Counterpoint Cloud Platform
Documentation for Counterpoint Cloud Platform
- Updates
- Beta V 1.1.0
- Beta V1.2.0
- Beta V1.3.0
- V1.3.0
- V1.3.1
- V1.3.2
- V1.3.3
- V1.3.4
- V1.4.0
- V1.4.1
- V 1.4.2
- V 1.4.3
- V 1.4.4
- V 1.4.5
- V 1.4.6
- Introduction and Getting Started
- FlightDeck
- CounterCRM
- Counter Message
- E-Cat Analysis
- Resource Centre
- CPMailer
- Report Generator
- CP2 Admin
- Registration and Users
- QuickDial
- Common Error Messages
- Prebuilt Reports
Updates
Beta V 1.1.0
The following is a listing of the updates released in the Countrpoint Cloud Platform (CP2)
Branch Classification
We have introduced the ability for you to group your branches by Region, Type and Size. As an admin user, you will now have access to the Branch Management module

Entering into Branch management will give you a listing of all of your branches, and optional drop-down boxes to assign your branches to the various groups.

To create classifications, you can navigate into any of the Region/Type/Size headings to create new categorizations that can then be assigned to branches

Modified Flightdeck
The FlightDeck Dashboard has been modified to focus solely on performance indicators and allow you to filter what data is used to make up your Key performance indicators. The default view is a month to date total for all accounts under your control with comparatives to the same period last year.
The new features allow you to click on the 'Current View' tab to adjust that view

Clicking the punch-out will present you with the various filtering options available to you

This includes changing the current period being analyzed, the comparative period it is analyzed against, the specific branch or branches that are to be included as well as specific customers to be used. As you select the options and press the submit button, your dashboard indicators will be updated with these filters.
Enhanced Goals
With the migration of flightdeck to a more indicator focused model, the goals have been moved to their own subsection.


Clicking the name of any of the goals will present you with the goal detail, and clicking the View/Edit Goals link will let you add/maintain the goals
Pre-built Reports
Another piece of the old dashboard was the drill-down customer sales table. This has now been moved to a section that will be expanded on in future releases.

Under the report generator module, a new Prebuilt Reports sub-module is available. At the moment, the details sales drill-down tables is the only new report listed
 \
\
As feedback is received, custom reports will be placed here for user consumption.
Expanded Report Generator
The basic Sales and Inventory reports have had numerous new detail fields, as well as aggregate fields added. Some to note are First Item Sale, Last Item Sale, Total of current 12 months sales, Total of Previous 12 months sales, all price levels and transaction types along with numerous others.


Overnight Reporting
The weekly and monthly emailed reports within CPMailer have been modified to compare the current week/month to the same week/month of last year.
CounterCRM
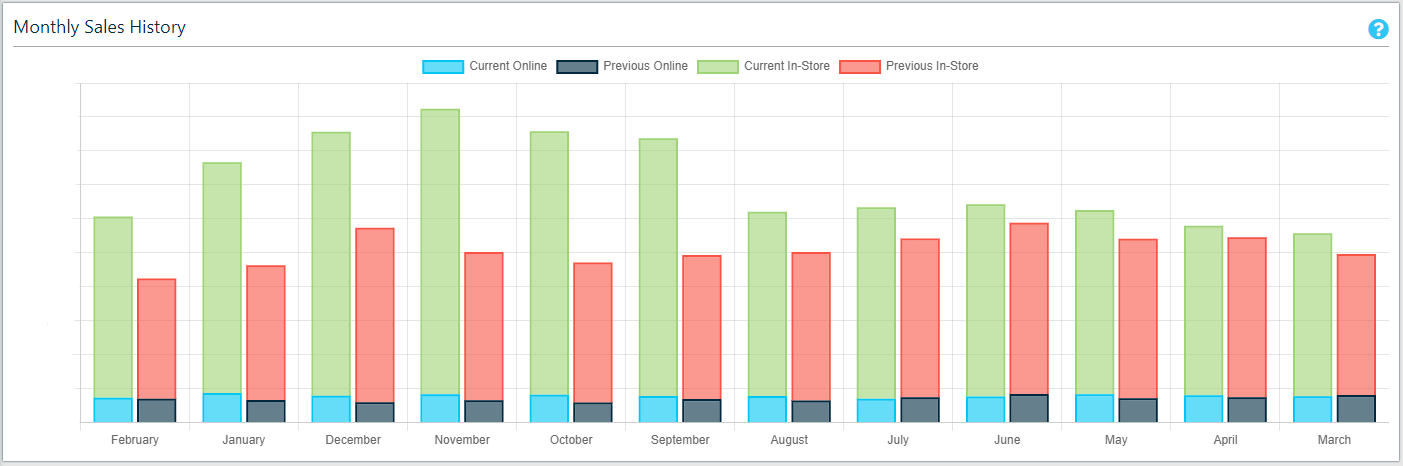
A minor addition to the CounterCRM module includes a new 'Monthly Sales History' graph that displays the customer's sales by month over the past 12 months with a comparison to the previous year

Sales comparisons have also been updated to represent a year-over-year comparison
Beta V1.2.0
The following is a list of the feature changes from Beta V1.2.0:
FlightDeck Dashboard
Updates to the FlightDeck Dashboard tiles, adding a breakout for online sales and moving the tiles into a tabbed panel.

Added the GP% at the end of customer and clerk names in the Top Customers by Sales and Top Clerks by Sales graphs.
Added a second "Sales By Day" chart, totaling the cumulative sales over the period.
Inventory Dashboard
Added a new page onder the FlightDeck module for Inventory analytics. This includes some base metrics such as total inventory values by branch and category, top categories by value, old stock value, old stock by category, and turns. These metrics also follow the same conventions as the Flightdeck sales dashboard wherein the user can filter by branch, or group of branches. If they have already made a filter selection within the sales dashboard, that selection follows to this page.
Goals
Minor visual changes to create an obvious vertical break between the goals.
Also added in the target value as of today to the graph so that the gauge shows a relative point where the user should expect to be based on how far along you are in a month. This is shown as a floating number above the arc of the graph.
CounterCRM
System now remembers the last customer you selected. Before, once you left the CounterCRM you would have to re-select the customer if going back in. Now, you have the option to go back to any of the CounterCRM pages with that same customer or go to the customer selection screen.
Also added in a yearly sales graph by month and properly sequenced it to be reverse chronological.
Weekly Alerts
Same as the monthly sales alert reports (Sales down X percent, or 30/60/90 beyond a threshold), but can be sent on a weekly basis. Toggled independently of the monthly sales alert reports.
Report Generator
Added in the remaining fields from our import data, as well as things like first sale, last sale, average cost.
For reports generated and saved after the update, you will have the option to return to the edit menu with the report's options filled out from the saved reports list.
Prebuilt Reports
Historic Sales Report - Historic sales report, but month, for the past 3 years showing Sales and GP%. Able to be filtered by branch or group
Historic Inventory Report - Historic inventory report, for the past 3 years showing inventory value by month. Also able to be filtered by branch or group. Also includes line graph for visual representation.
This data is collected independent of Counterpoint. If you would like your historical data loaded in, please contact support to discuss options.
Next Release
The next release is expected to being the ability to grant users permissions to different pages and branches, as well as change the method by which new members register. If you have thoughts or opinions on how you would like to see this implemented, contact support.
Beta V1.3.0
CP2 Manager Module
- Allows administrators to 'invite' new users vs. the old registration method.
- CP Manager is also a new user permissions module that allows a company admin to create users and assign permissions to a user. This allows you to limit what modules and/or branches a user has access to. You are also able to create 'Manager' users. These users will be able to invite additional users who will be limited in their permissions based on the manager who invited them.
Additional metrics introduced on the FlightDeck sales dashboard.
- New Cumulative Sales graph.
Additional Custom CPMailer report.
- Now sales staff can elect to get their customer alert report on a weekly basis. Sent on Monday mornings.
Additional Prebuilt Reports
- Detailed Sales History - Shows a table of the last 6 months sales & GP% by category, indicating where sales were up or down. Information is presented in a table which features the 1 click export to CSV/Excel/PDF
- Detailed Inventory History - Shows a table of the last 6 months inventory value, by category indicating inventory value and difference from month to month.
V1.3.0
This release takes aim at a number of new and very exciting features aimed at adding efficiencies for your counter staff. This release also takes us out of our beta testing and to a production/live infrastructure.
QuickDial
- Seamless integration between your AMS PBX phone system, and your COUNTERPOINT point-of-sale by way of the COUNTERPOINT cloud platform.
- QuickDial launches as soon as you answer a call, using the CallerID to find the customer.
- Ability to launch a COUNTERPOINT invoice session for a customer directly from QuickDial with one click
- Launch a customer invoice, or invoice for specific ship-to
- Single screen with many pieces of customer specific info at your finger-tips
- Customer account status
- Delivery run/run time info
- Detailed invoice search
- Integration with JDispatch for visibility of current deliveries
- Last ecat access
- Pop-up notices for important notes on account
- Seamless ability to assign unlimited additional contact phone numbers to an account
Sales FlightDeck updates
- Changes to values/headings in top card for more clarity on meaning
- Ability to customize field headings
- Persistent visibility of current data filters
Inventory FlightDeck updates
- Add last cost to old stock report
- Add validation against 'date added' into old stock report
- Introduction of 12 month and 24 month old stock KPI cards to inventory flightdeck
- Persistent visibility of current data filters
CounterCRM enhancements
- Ability to import call logs from AMSPBX system into CP2
- Includes Call date, duration and recording (if available)
- Ability to assign 'pop-up' notes in the QuickDial page
- Introduction of sales-rep 'focus' list.
- Ability to manually add customers to your focus list
- If enabled, 'focus' customers are listed first for quick access when browsing CRM
- Customer specific sales alert targets
- Override the system defaults on
- Sales decrease threshold
- 30 day overdue threshold
- 60 day overdue threshold
- 90 day overdue threshold
- Override the system defaults on
Revamp of CPMailer management and new reports
A number of enhancement to the overnight reporting module
- Redesign of the report assignment screen
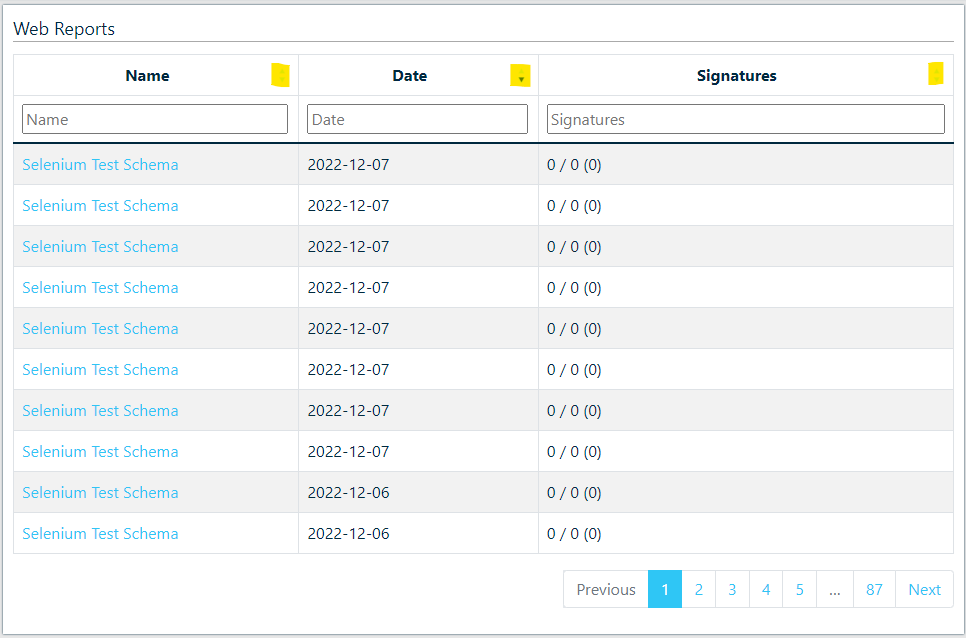
- New 'Web Report' type
- Users are sent an email and can log in to view the report
- Can create 'audited' web reports which require signatures
- Introduction of a number of new overnight reports
- Top 10 Categories
- Top 10 Classes
- Top 10 Customers
- Top 10 Gaining Categories
- Top 10 Gaining Classes
- Top 10 Gaining Customers
- Top 10 Gaining Industries
- Top 10 Industries
- Top 10 Losing Categories
- Top 10 Losing Classes
- Top 10 Losing Customers
- Top 10 Losing Industries
- Low Margin Report
- Users who have an associated salesrep ID on their account can receive most of the existing report types only for their sales, via a second column of "User" blocks.
- Expansion of backend API to allow custom reports to be sent from your Point-Of-Sale system to users via the cloud platform via a simple .csv upload
- Recipient management all done through the platform
ResourceCenter Rework
The ResourceCenter module has been rewritten to take advantage of some additional security measures. This also sets up some nice improvements and features we can introduce in the near future, stay tuned!
New fields in custom report generator
- Introduction of unique invoice count as a summary value in Report Generator
Updates to Prebuilt Reports
- Sales table now has the ability to adjust the comparative date ranges beyond just MTD/YTD.
Admin Updates
- Admin users aren't required to know the user's password if they wish to change it.
Bug Fixes & Improvements
- Implementation of Redis for speed improvements
- Refactoring of queries for speed improvements
- Use default branch in prebuilt reports to present default values without needing to select
- Users can now reset their own password via a link sent to the email address they registered with
- You will now be redirected to the login page if your session has expired
- Big performance upgrades when revisiting a loaded page
V1.3.1
Enhancements
- Document sharing updated to allow saving of documents at a user level
- Back-end security enhancements
Bug Fixes
- Counter message close link
- 'Inactive User' styling fixes for QuickDial
- Show proper 'success' message when updating user email
- Update messaging for users without counter messages
- Properly update display name on change without needed a refresh
- Fixed bug where CPMailer would return to the wrong page
- Better error handling on database errors
V1.3.2
New Features/Enhancements
Alias Notice in QuickDial
When a lookup is performed using an Alias, the following warning is now displayed at the top of the page.

This should help deal with any cases where an incorrect alias is used during an automatic lookup, and prevent confusion as well as provide a link back to perform a manual lookup.
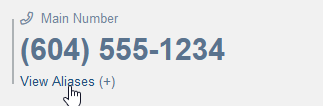
Alias Listing in "Main Number" Tile
In both the QuickDial and CounterCRM modules, the customer information tile that contains the "Main" phone number for a customer now includes a link to view a list of all aliases associated with that customer.
Customer Focus List Includes Customers with Alerts
The Customer Focus/Target list now automatically includes your customers who have an active customer alert, and displays which alert(s) are currently triggered from the customer listing. This is now the default view on the CounterCRM customer lookup page, and the full listing is available at the top of the panel.
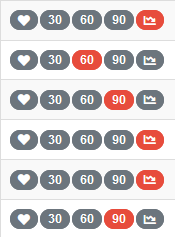
The different types of alerts are shown as badges, with a grey badge being an inactive alert and a red badge being an active alert.
 In order: Manual Focus, Net 30, Net 60, Net 90, 30 Day Performance.
This customer is triggering the Net 60 and 30 Day Performance alerts.
Added Customer Alert CPMailer Block
The new "Customer Alert" CPMailer block contains a list of customers who have triggered an alert based on their performance over the last 30 days. These alerts are the same ones that cause them to appear in the focus list in the CounterCRM module, and the same as the ones that appear in their CounterCRM profile.
This report block is always calculated over a 30 day period, regardless of the frequency of the report.
Sending CounterMessages from Within QuickDial
Via the CounterMessage tab it is now possible to send a CounterMessage tied to the current customer through QuickDial. The interface is the same as you would expect from the CounterMessage module, with the customer field pre-populated.
Basic Audit Log
This update introduces a basic audit log that is available to admin users. To start, the audit log tracks the following events:
- User login
- CounterMessage creation
- User password/email/name changes
- User Impersonation Events ("Log In As")
- WebReport signin
This list is expected to expand in future versions as features are added and changed.
Removed
CPMailer Special Reports
The CPMailer Special Reports used to only consist of a weekly/monthly "Customer Alerts" email. Now that customer alerts are available in a standard CPMailer block this report serves no purpose - and since it was the only report in this space, the CPMailer Special Reports page has been removed.
Note: There is no automatic migration between the Special Reports and the new CPMailer report block. If you wish for each salesperson to continue to receive this report, it must be added to a CPMailer report.
Bug Fixes/Small Changes
Fixed Stale Inventory Bug
Fixed an issue in the nightly upload process that was preventing inventory values from being calculated correctly.
Top Sales by Clerk
When filtering the FlightDeck Dashboard for a specific customer, the "Top Clerks" graph now properly renders again.
User Goals Display
Fixed an issue that could cause user goals to not render properly when trying to view all sales goals, which would result in the page infinitely loading.
Password Reset Functionality
Fixed an issue where the password reset function would sometimes get stuck when processing an invalid request for a password reset.
V1.3.3
New Features/Enhancements
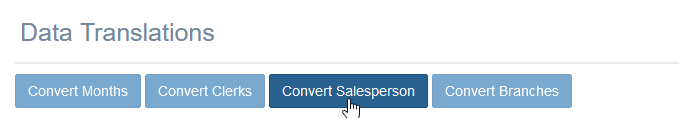
Report Generator Exports Converted Data
Using the report generator, changes made to data via the "Convert _____" buttons after generating a report are now exported using the buttons at the top of the report. "Convert Salesperson" has also been added as an option.
Import "firstAdded" for Individual Items in Inventory
The date an item first appeared in inventory is now tracked by the COUNTERPOINT Cloud Platform. In some existing breakdowns, such as the "Inventory Old Stock" table if enabled will use this data to filter out items that do not yet have any sales.
Export Data from WebReport
Added in a CSV export option for data associated with WebReports. This should help accommodate reports with a width larger than the page, but still requires that you return to the WebReport in order to sign.
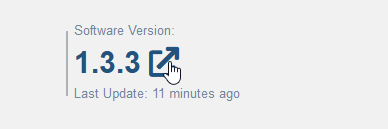
Direct Link from Current Version to Release Notes
The home page after you log in now includes a link in the "Current Version" tile taking you to the docs page for the release notes.
Bug Fixes/Small Changes
Data Import Stability
Fixed a scenario that could cause upload data to not be imported correctly during the nightly process.
Nightly Process Stability
Fixed a series of scenarios where some actions (CPMailer Reports, WebReports, Password Reset Requests) could fail to be sent out after network issues occur, and require manual intervention.
QuickDial Invoice Count Restored
Fixed an issue with the Invoice Count tile in QuickDial always displaying 0, or an incorrect value when using an account that does not have permission to access data from one or more branches a customer has purchased from.
CounterCRM Recent Activity - Customer Alerts Labels Changed
Changed some of the labels under the Customer Alerts tab of the Recent Activity panel to clarify which dates are being used in the displayed comparisons.
Fix Auto-Targeted Customer List Displaying
Introduced in version 1.3.2, the automatic targeted customers based on customer alerts would only display when you had at least 1 customer manually targeted. With this fixed, the "Targeted Customers" is now the default display for the CounterCRM Customer listing. This allows you to see a list of your customers as well as which alerts are being triggered at a glance. Of course if you're looking for a specific customer, the "All Customers" panel is still available via a button at the top.
Add Border Around Panel Menu Buttons
Some of the panels are gaining different views you can switch between, but it wasn't always immediately obvious if you weren't expecting it. As the CounterCRM customer lookup page now features these buttons, we've added a border around the buttons which should help make it a bit more obvious when there are multiple views available.

V1.3.4
New Features/Enhancements
New Fields
There have been a number of new fields added to the custom report generator
- Sales Product Group
- Linetype
- Product Return Rate
- Warranty Return Rate (%)
- Warranty Return $
- Product Return $
- Core Return $
Enhancements to FlightDeck Sales Breakdown Table
The FlightDeck sales breakdown table has been updated to list all breakdown options along the top, and the new Product Group has been added as an option

Enhancements to FlightDeck Graphs
The FlightDeck graphs have been beautified slightly to render differently.
Small Changes / Bug Fixes
- Fix to bug in password reset function
- Fix to bug in branch conversion routine within custom report generator.
V1.4.0
V1.4.0
New Features /Enhancements
Report Generator Rework
As part of some upcoming features, the Report Generator has been rewritten to improve the flow of creating a new or viewing a saved report.
When you generate a report, it now displays the report content in a modal:
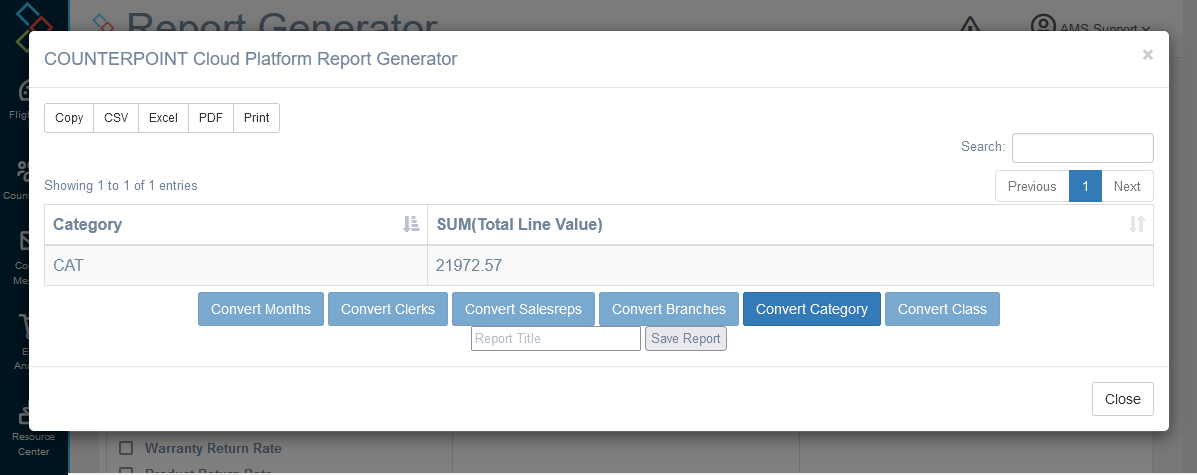
Which should be functionally the same as the previous method for displaying the data.
The Saved Reports page has received some updates, including some exciting new features:
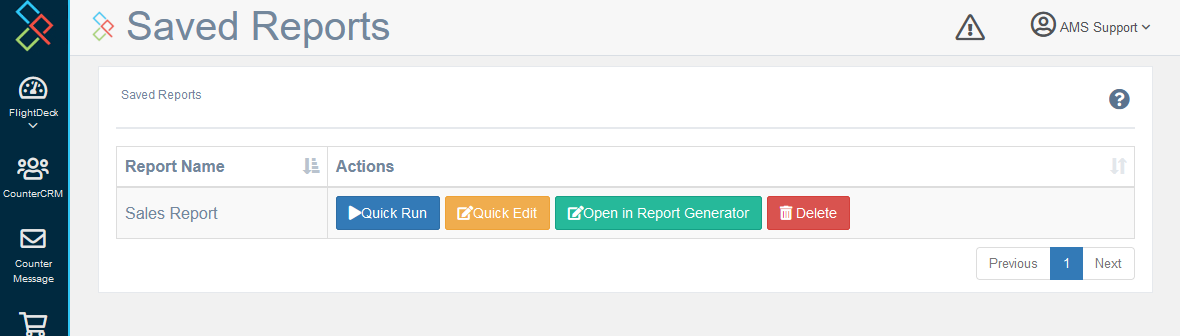
Notably, the first two buttons are new:
Quick Run: opens the report in a modal much like seen above, without leaving the Saved Reports page.
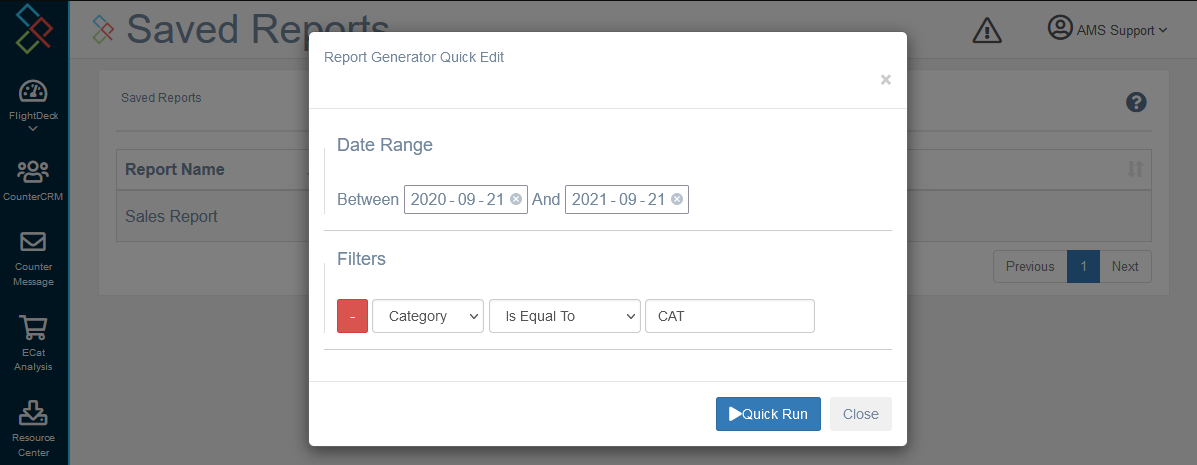
Quick Edit: opens a small modal allowing you to adjust the filters and date range (if applicable) of the report before running it.
Additionally some of the placements of the fields in the report generator have moved, and there is no longer a default report type selected.
Unfortunately, old saved reports are not compatible with this new format. If you need to know what fields you had used in a previous report, please contact AMS for assistance.
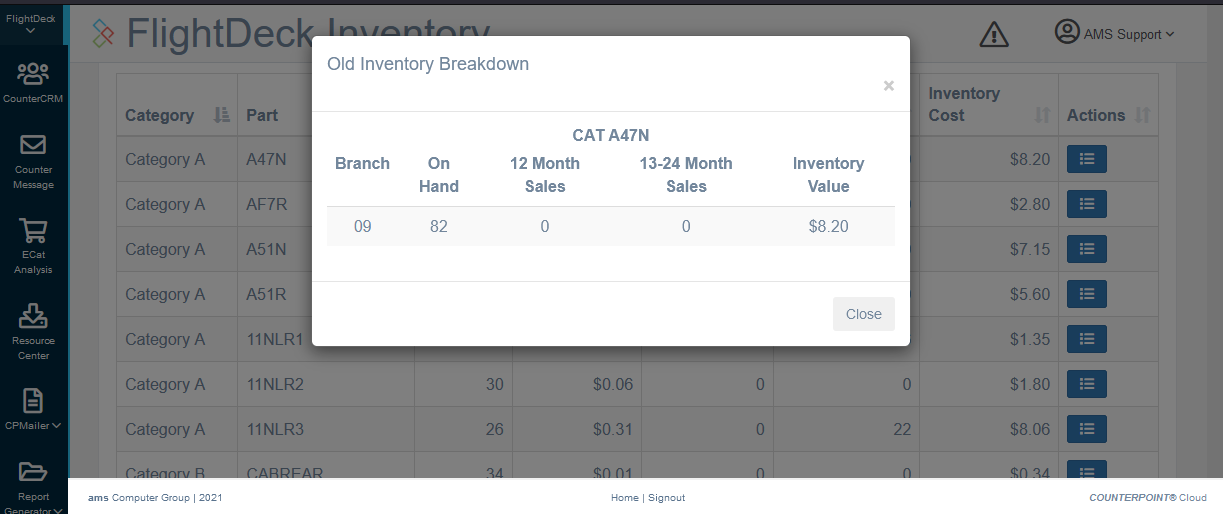
Inventory Old Stock Breakdown
The Old Stock table in the Inventory Dashboard now has a new column, "actions":
QuickDial Shows Active Calls
In the QuickDial module with PBX integration enabled, any active calls are now displayed from the customer lookup screen.
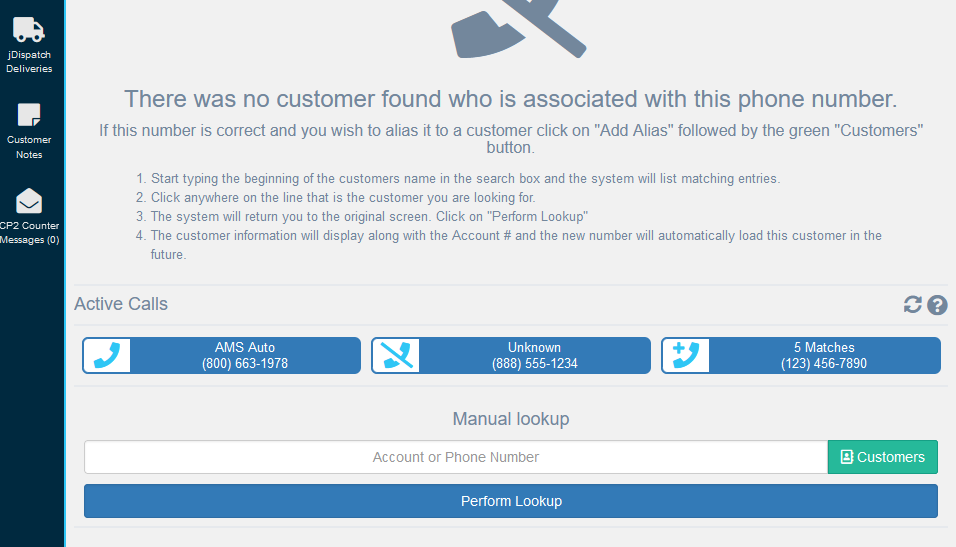
This aims to make the QuickDial module much more approachable for companies that don't wish to use a queue-based call answering program, and makes it easier for an agent to support a customer who was previously placed on hold. Clicking on the element will navigate to the QuickDial screen relevant for that call, as if they had just called in.
Up to 15 calls can be displayed here, where any call which the COUNTERPOINT Cloud Platform has not received notice that the call ended yet within the last hour is displayed. The display checks for new calls every 10 seconds.
Small Changes / Bug Fixes
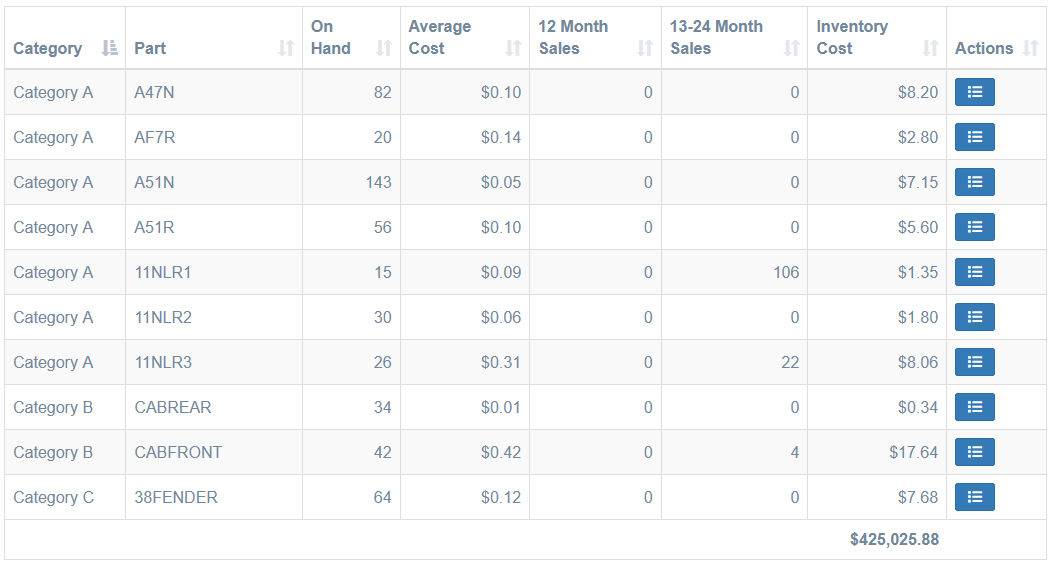
- The "Prebuilt Report" Sales Table now includes a summary row at the bottom.
- Added nightly procedure to fill in the Customer Name field on Ship Tos that do not have a name assigned to them.
- Introduced changes and GUI interfaces for API keys as we get ready to add more features that utilize them
- Fixed some API calls having optional arguments that didn't have default values associated with them
- Fixed "Gross Sales" tile in CounterCRM not functioning correctly
- Fixed salesperson restrictions not applying correctly in some data breakdowns
- Fixed an issue that was preventing nightly routines from running correctly for newer accounts
- Added more automated tests that are run automatically to catch errors before new features are released
- Switched some libraries from external sources to being hosted internally, so page loading times should be more uniform
- Updated some libraries to the latest versions available
- Added a breakdown "summary' row to the Prebuilt Report "Sales Table"
- Fixed Flightdeck's "Top Clerks" graph not having the account filter applied correctly
- A user's password is now required to change their email address.
- A new nightly procedure to fill in the Customer Name field on shiptos that do not have a name associated with them.
- Rewrote the ACA data mapping procedure to be more efficient.
As well as numerous tiny fixes, and behind-the-scenes upgrades to increase performance and gt ready for exciting changes we have planned!
V1.4.1
V1.4.1
New Features/Improvements
Added a "Fiscal Year" selection to time-based comparisons
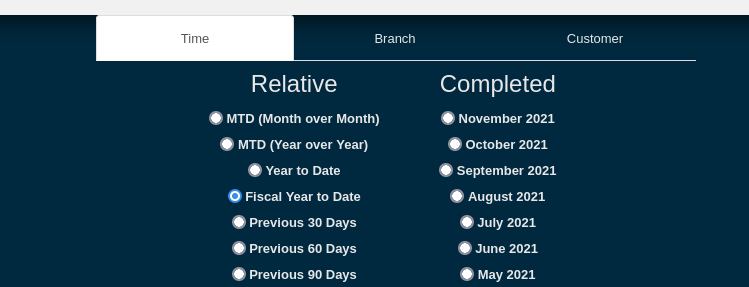
Note: This relies on the "fiscalStart" setting, which defaults to "01-01". This setting is available under Server Settings in the CP2 Admin module.
Remove cash/retail accounts from Top Customers
The "Top Customers By Sales (GP%)" graph on the FlightDeck Dashboard now excludes accounts that are listed in the cashCustomers admin setting.
CPMailer Date Comparison Daily/Weekly Update
The CPMailer module now pulls same day of same week for its daily reports.
i.e. a Monday will always be compared to a Monday, and so on.
Additionally, weekly comparisons should now work correctly on years that have 53 weeks when they are compared to years with 52 weeks.
"Returns" CPMailer Block
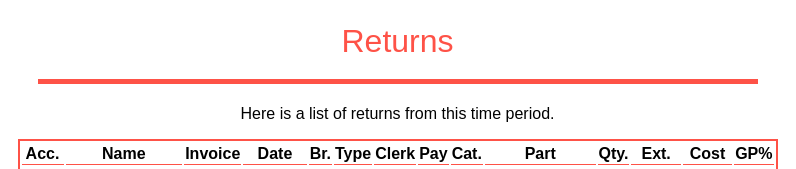
A new CPMailer report block adds a list of returns to your nightly, weekly, or monthly email.
This report block may be temporary, as this information may become available as part of a bigger analysis on the COUNTERPOINT Cloud Platform at a later date.
Note: On a weekly or a monthly report, this block can get to be quite long.
New Custom Reports Fields
Sales Reports
- Invoice Day of Week: The day of the week that the invoice was sold (Monday, Tuesday, etc..)
- Invoice Hour: The hour of the day that the invoice was sold (Represented in 24 hour format)
Inventory Reports
- Avg Cost - Current: Average cost value of items that have been sold in the past 12 months
- Avg Cost - No Sales in 1 year: Average cost value of items not sold in past 12 months, but sold in past 13-24 months.
- Avg Cost - No Sales in 1 year: Average cost value of items not sold in past 24 months, but sold in past 25-36 months.
- Avg Cost - No Sales over 3 years: Average cost value of items not sold in past 36 months.
Small Fixes
- Fixed an issue where old files could be stuck cached in your browser, preventing you from loading the new version of a module
- Updated the list of columns available in the Report Generator
- Removed duplicate columns from being displayed in the Report Generator
- Modified the Minimum and Maximum columns on an Inventory report to work properly with filters
- Fixed the Quick Edit UI not displaying properly when editing a saved report
- Restored the export buttons on the Old Stock Report table
V 1.4.2
V 1.4.2
New Features/Improvements
Improved Styling
The style of the COUNTERPOINT Cloud Platform looks a little different with the release of 1.4.2. These style changes are necessary as we update the libraries that power The Cloud Platform, and represent a lot of work in making sure we're able to offer features at the forefront of what web browsers are capable of. There's too many changes to list them all over here, but see the screenshots of various features for examples.
New Administration Page
The administration page no longer hides analytics, because that didn't make much sense. Instead, the page is the new home for administrator-level options and functions.

This new admin page still gives a instance-wide view of the amount of data involved, but now it includes the ability to clear cached values, as well as see and run the data procedures that process data that powers the COUNTERPOINT Cloud Platform.
Updated Filter Selection Header

The filter selection bar has been modified to be more streamlined, providing more visibility of your statistics onscreen. Clicking the 'Current Data Filters' will present you with the ability to modify the filters.
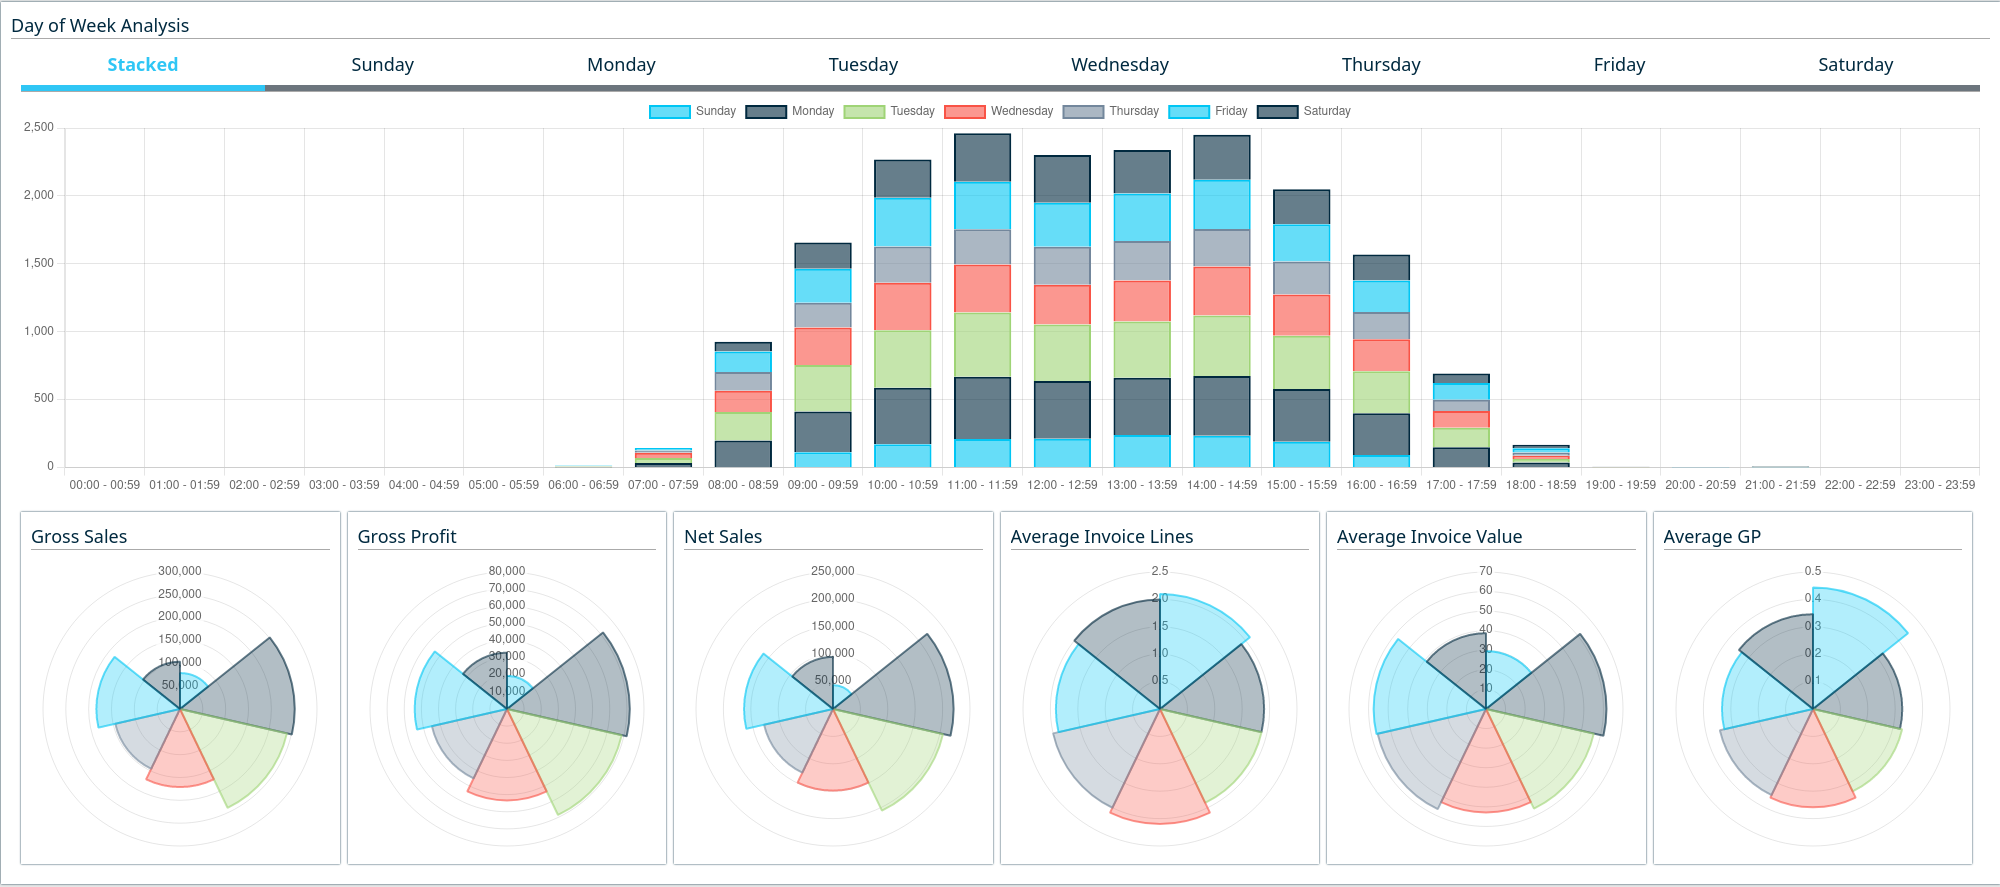
Day of Week Analysis Report
Replacing the sales heatmap that used to live on the administration page, the Day of Week Analysis Report in the Prebuilt Reports module offers a breakdown of sales per day of week per hour over a given period.
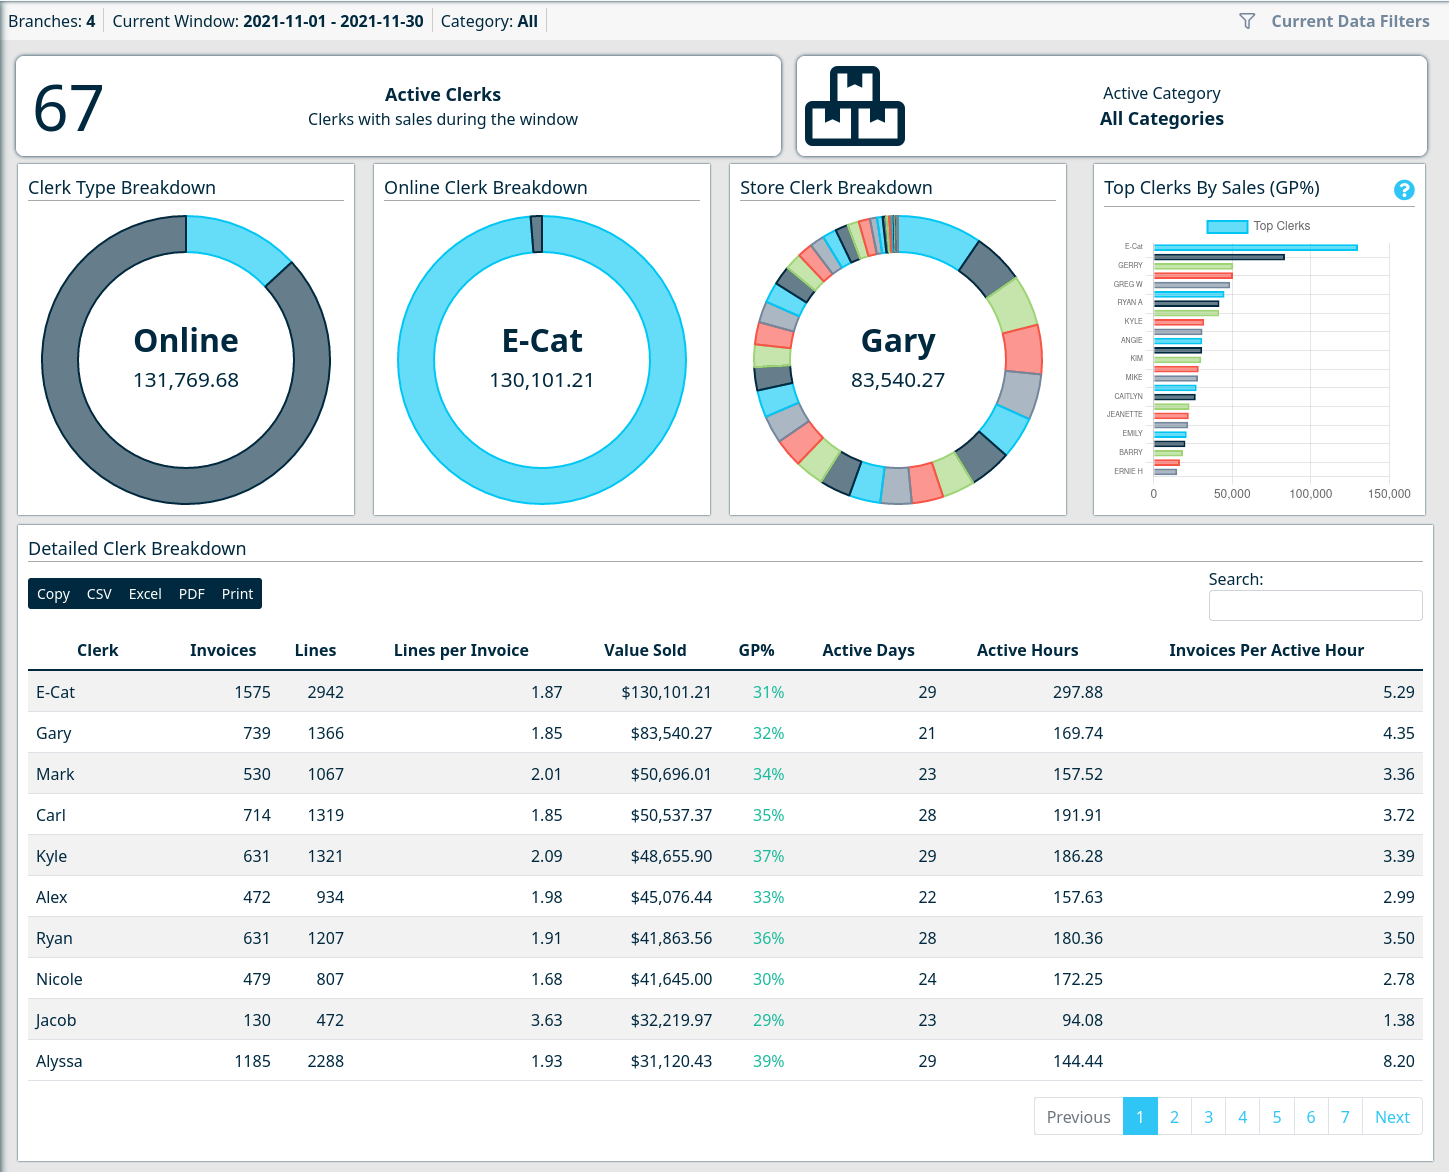
Clerk Analysis Report
Similar to the Day of Week Analysis Report, the Clerk Analysis Report offers a breakdown of sales per clerk, and extrapolates some additional information that wasn't previously available such as "Active Hours" and "Invoices Per Active Hour".
"Active Hours" are calculated by subtracting the time of the first invoice on a day from the last invoice on a day for a single clerk.
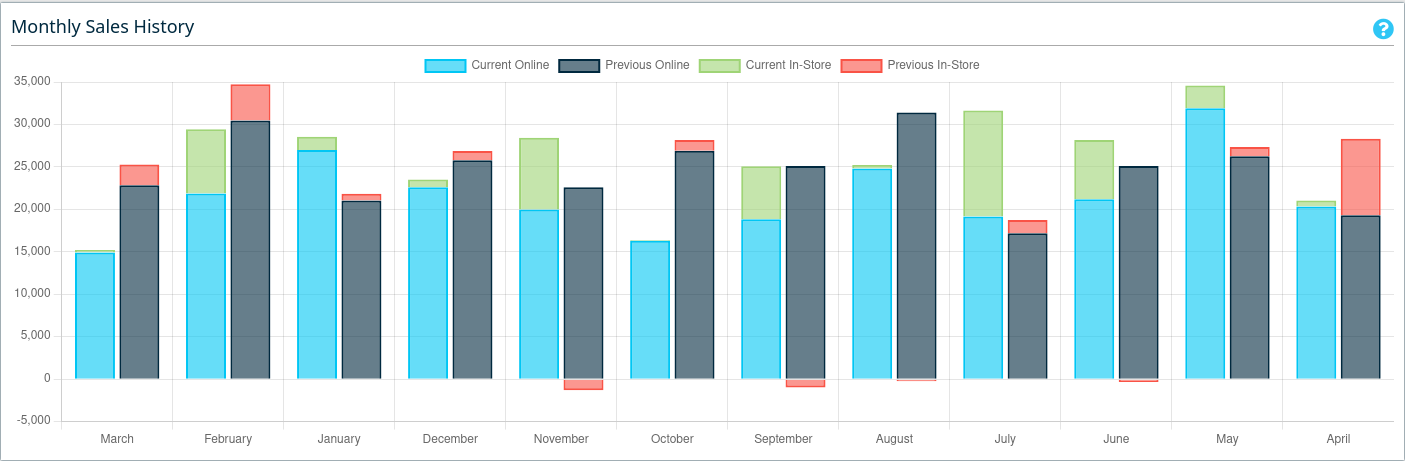
Stacked CounterCRM Monthly Sales History Graph
Alongside being updated to a newer library version, the Monthly Sales History graph is now broken out into "online" and "in-store" sales.
Ability to Archive Users
In scenarios where a user needs to be disabled, the CP2 Manager User Management page now allows you to archive a user. Select the user in question and, under the 'Special Actions' tab is the option to archive the user.
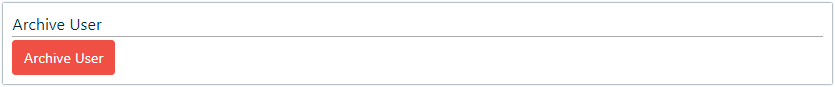
This will disable their access and remove them from user listings.
Addition of Bin Location
The bin location field has now been added to the Custom Report Generator screen

Small Fixes
- Fix performance of WebReport Schema User selection when many WebReport schemas have Andbeen created
- Modified the labels and icons of some sidebar categories to better represent their contents
- Tons of small changes with the new theme and library updates
V 1.4.3
New Features/Improvements
Below is a complete listing of the new features included in this version
New Flightdeck Data Filter Period
- Ability to display FlightDeck data for the past 12 months, compared to the previous 12 months
Additional Sales Flightdeck Metrics
We've added a number of new KPIs and sales metric breakouts to the Sales Flightdeck dashboard
Cash/Charge Breakdown
Additional breakouts of Cash and Charge totals have been added to the top sales panel switcher in addition to Online/In-Store
Monthly Sales Breakdown
A breakdown of sales, by month, for the past 12 months. The graph compares the past 12 to the previous 12 by month and stacks in-store and online sales
Sales By Sales Rep
A new bar graph to display sales by sales rep for the period selected in the filters
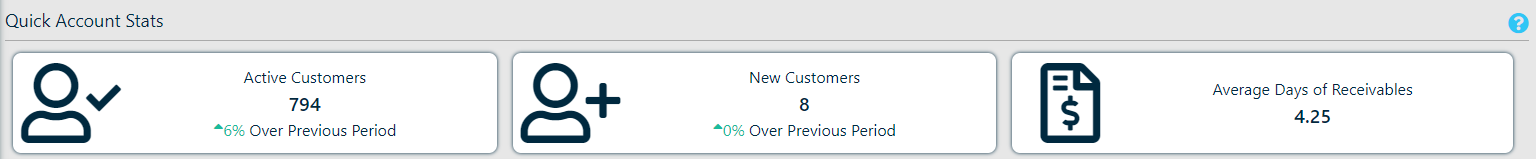
Account-Based Metrics
New tiles reporting number of active customers, number of new customers and the current average days of receivables.
Additional Inventory Flightdeck Metrics
All new metrics in the inventory dashboard will update based off of the values entered in the data filters.
Past 12 Month Inventory Value
A graph has been added to display trends in average inventory value over the past 12 months.
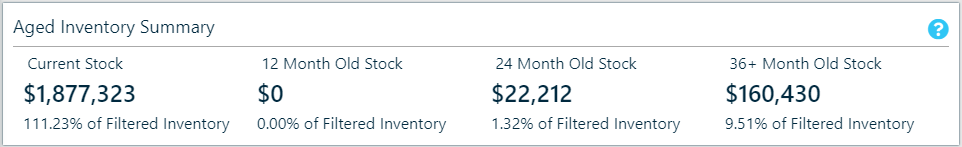
Aged Inventory Summary
We've added in a new 'Aged Inventory Summary' panel to give you quick visibility of your inventory aging, up to 3 years. This panel also reacts to the filters you have set for your inventory Flightdeck.
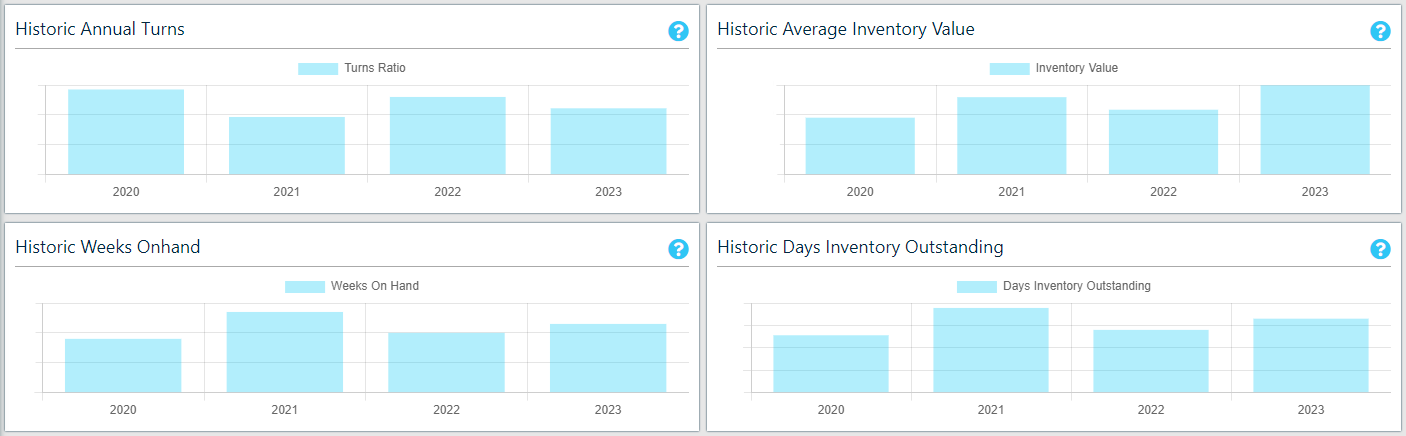
Historic Graphed Metrics
We've added in 4 new graphs to show historic trends in:
- Inventory Value
- Inventory Turns Ratio
- Days of Inventory Outstanding
- Weeks of Inventory On Hand
Additional Summary KPI Panel
We've also added in another summary panel of inventory metrics for the previous 12 months
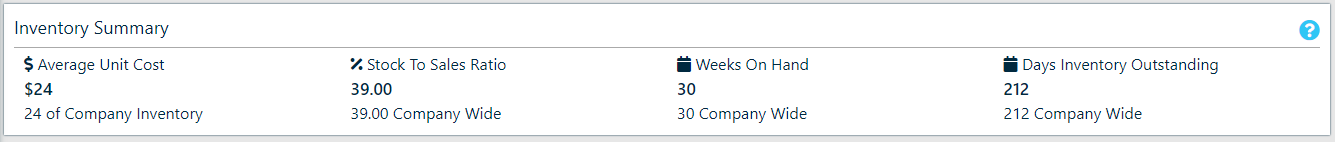
This panel includes:
- Average Unit Cost - Average cost of a single unit based on entire inventory value divided by number of units onhand
- Stock to Sales Ratio - Average inventory value / Total sales for the past 12 months, represented as a percentage
- Weeks On Hand - Average inventory value / Total cost of sales for the past 12 months * 52 weeks
- Days Inventory Outstanding - Average inventory value / Total cost of sales for the past 12 months * the number of days in the year
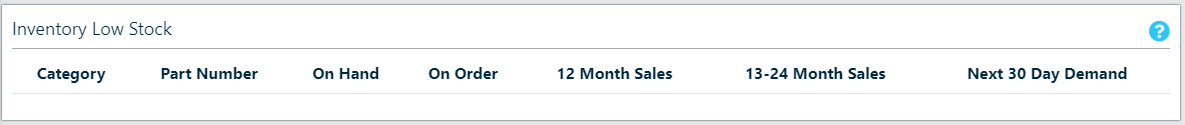
Updates to Low Stock Table
Also in your Inventory Flightdeck dashboard, we have added 2 new columns to the Low Stock table
- 13-24 month sales: The total sales of this item between 1 and 2 years
- 30 day demand: Based on sales, this is the demand of product needed in the next 30 days
More Custom Report Fields
Aggregate Fields
We have added a number of new aggregate fields to the custom reports:
- Combined Customer/Ship To Name: A field that will combine multiple ship-to names into one column when running a report on account only
- Total Charge Sales: A calculated total value of charge sales for your selection
- Total Cash Sales: A calculated total value of 'cash' (non charge) sales for your selection
- XX Day Aged Charge Sales - Total charge sales values, aged to correspond with Customer aged AR balances
- Total Returns in Dollars
- Product Returns
- Core Returns
- Warranty Returns
- Total Defective Onhand: A calculated total of the defective onhand based on your report criteria
- Total Lost Sales: A calculated total of the lost sales based on your report criteria
- Total Customer Backorder: A calculated total of the customer backorders based on your report criteria
- Total Supplier Backorder: A calculated total of the supplier backorder based on your report criteria
New Type of Aggregate Field
We have added a new Historic Sales group of fields, which include a number of segmented total values
These fields still adhere to the date range filter, so to get accurate values you must select a date range that would include the selected dates. For example, to get 'Total Sales - 3 Year', your date range must go back over 3 years.
- Total Sales - We have added fields to break provide Total Sales $ by the following:
- Per month for the past 6 months
- Total Sales - 1 Year
- Total Sales - 2 Year
- Total Sales - 3 Year
- Previous 12 months total
- YTD total
- Previous YTD total
- Total Quantity - We have added fields to break provide total quantity sold by the following:
- Per month for the past 6 months
- Last 12 months total
- Previous 12 months total
- YTD total
- Previous YTD total
- Charge Sales - Month: We have added in the ability to add in charge sales totals, specifically by month, for the past 6 months
Additional Sales Fields
- Levy Cost
- Levy Value
Additional Customer Fields
- Credit Limit
- Credit Rating
- Date Created
- AR System Type
- Customer Type
- Has Statement
- Contracts Allowed
ALL Inventory Fields
We have also added in all fields found within the COUNTERPOINT inventory. This includes all fields present in the product maintenance screen within Counterpoint
Field Descriptions
We have made a number of updates to the summary / aggregate field descriptions to better identify their data and use.
Custom Report Enhancements
New Filters
Custom reports now have the ability to add a 'Not Equal To', 'Is One Of' or 'Is NOT One Of' filter
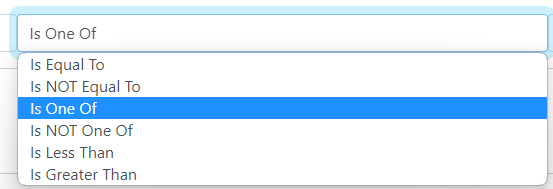
- Is NOT Equal To: The listings will not be returned for any records not matching this criteria
- Is One Of: Listings will be returned for any values matching one of the listed options. Options must be separated by a pipe "|" symbol
- Is NOT One Of: Listings will NOT be returned for any values matching one of the listed options. Options must be separated by a pipe "|" symbol
This new feature also extends to allowing users to filter on 'not empty' or 'empty', by entering a space in the Value field.
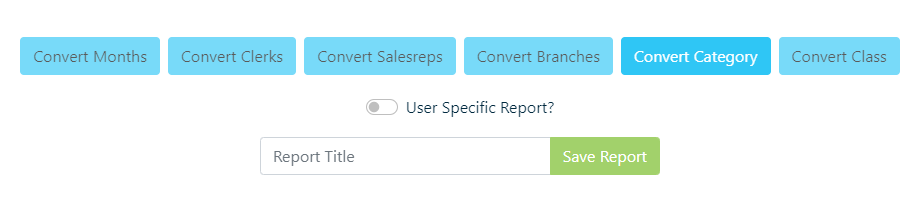
User Specific Reports
- When saving a report, you can opt for the report to be 'User Specific', meaning that only the user who created the report will see it in the saved reports listing.
Web Report Enhancements
- Added column sorting and filtering to the web report listing
New Prebuilt Reports
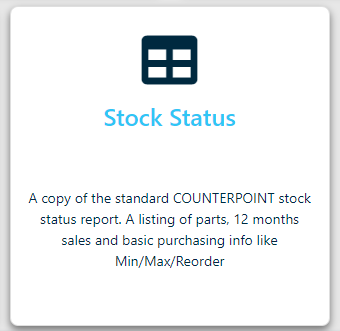
- Added in a Cloud equivalent to the Counterpoint Stock Status Report. This report requires a category be entered and can be run for one or many branches

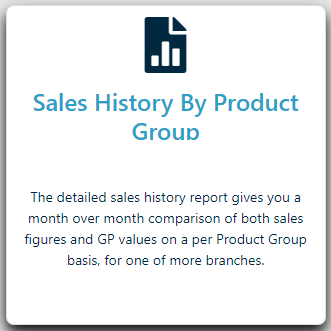
- Added a new 'Sales History By Product Group' report which shows the same sales values as in the Sales History By Category report, but groups them by Product Group

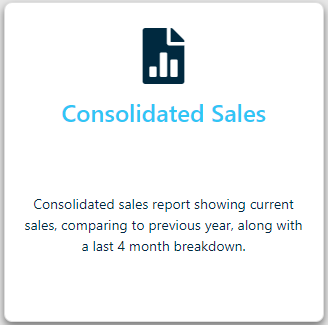
- Added a new 'Consolidated Sales' report which shows current sales compared to last year, as well as a 4 month breakdown of sales increase/drop. Also includes current inventory value.

Historic Inventory Predefined Report Update
- Modified the report to add columns for a 3rd year of history
General Predefined Report Enhancements
- Style changes to the predefined report landing page
- Modifications to some of the predefined report descriptions
- Modified the filtering on the sales listing table to be a 'contains' type search vs. an exact match.
- Modified the Historic Sales report to follow the standard branch filters used throughout the dashboard.
- No longer limited to a single branch
- Modified the detailed invoice search/listing report with the following
- Increased number of records per page
- Modified the font for easier reading
- Changed the category field to report category code vs. category name
Monthly Inventory Quantity Tracking
In addition to tracking the monthly inventory valuation, we will now also be tracking monthly onhand totals by category. The historic reporting on this will be available in a future release
CPMailer Enhancements
- Changed email headings for better readability
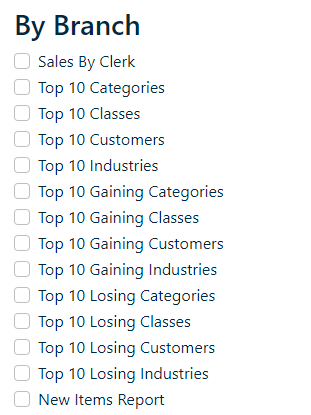
- Addition of a new class of CPMailer overnight reports. 'By Branch' reports will email you the specified reports, broken out by branch, based on your allowed branches.

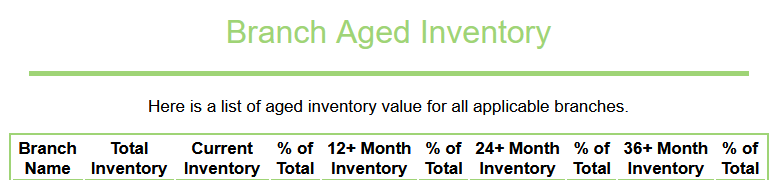
- Addition of a new 'Aged Inventory Value' report which will show a breakout of the aging of inventory, up to 36+ months, based on today

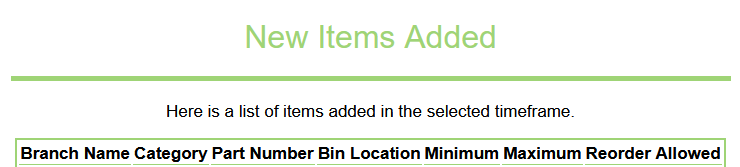
- Addition of a 'New Items' added, showing items added to the system for the timeframe of the report

CounterCRM Enhancements
- Added new customer information tiles
- Credit Rating
- Last Invoice (Amt & Date)
- Last Payment (Amt & Date)
- Credit Limit
- Added new 'Customer Annual Statistics (Past 12 Months, Year-over-Year)' tiles beneath the monthly sales breakdown
CounterCRM Changes
- Style changes to make for easier reading of customer notes.
- Style changes to customer information tile icons
- Style changes to make for easier reading of customer alerts.
QuickDial Enhancements
- Added new customer information tiles
- Credit Rating
- Last Invoice (Amt & Date)
- Last Payment (Amt & Date)
- Credit Limit
Bug Fixes
- Fixed the rounding of GP% in the prebuilt historic sales report
- Fixed the CounterCRM listing to group all customer's by Account number when more than one ship-to is available.
- Fixed a bug in the CounterCRM summary page causing the JDispatch 'All Time Deliveries' count to return blank
- Corrected the monthly sales breakout labels in CounterCRM as they were shifted off by a month
- We have modified a number of the custom field report names to make their meaning more obvious.
- Fixed a bug where ship-to numbers with different names would split when a custom report was only supposed to report on account
- Corrected table heading in Prebuilt Historic Sales report
- Fixed documentation links on all prebuilt reports
- Fixed logo size on CounterMessage reply page
- Fixed font color in CounterMessage email
- Fixed a styling bug that showed web report heading with white text on a white background
- Fixed a styling bug in the user registration screen
- Fixed a styling bug in the web report listing screen
- Fixed layout inconsistencies in Admin alert and Address book maintenance pages
- Minor style changes on e-cat analysis page to bring it in line with other page styles
- Minor style changes on 'Current Filter' selection tab
- Corrected a problem where the clerk analysis page would not show properly when there were $0 in web sales
- Corrected a problem in the Hourly sales analysis report where the stacked graph would not display if there were $0 sales on a given day
- Fixed a bug in the daily sales 'radar' graphs that incorrectly displayed Saturday sales as Sunday
- Fixed a bug in QuickDial which caused the page to not render properly on certain account
- Corrected the 'Forecasted Annual Turns' calculation as it was reporting too high in some cases.
V 1.4.4
Overview
In this latest update for our online business analytics platform, Counterpoint Cloud, we've focused on enhancing three key components.
Firstly, we've introduced Outstanding and Historic purchasing information. This feature empowers you to gain deeper insights into your purchases and supplier performance, providing you with valuable data to optimize your business decisions.
Secondly, we've conducted a comprehensive review of all CounterCRM pages, ensuring an exceptional mobile experience. We've also added new features to equip your sales representatives with the essential information they require while on the go or at a customer's location.
Lastly, we've put the finishing touches on our QuickDial module and seamlessly integrated Counterpoint Cloud with the AMS VoIP solution. This integration allows your clerks to access extended customer information and streamline order creation by simply answering the phone.
We're excited to introduce these improvements, which we believe will greatly enhance your experience with Counterpoint Cloud and help you make more informed business decisions.
Mobile-First Style Updates
We have made a large number of improvements, across the board in the Counterpoint Cloud Platform, to make the application more friendly on your mobile device.
Key focuses for this project were to ensure tables were accessible (notice the blue + symbol on table rows), graphs were automatically resized and that button contents and fonts were legible on all devices.
While these changes have been made in all modules, you will notice the greatest improvements within the CounterCRM and FlightDeck modules.
CounterCRM
Launch an autoecat session

A new customer action button that will launch a new session of autoecat (in a new window) and automatically log you in as the selected customer.
Once logged in, you can browse the catalogue as the customer, showing their pricing and place an order as if you were them.
CounterMessages Listing
The 'Recent Messages' tab has been updated to show both open and closed messages, as well as replacing the message 'Hash' with the current status of the message.
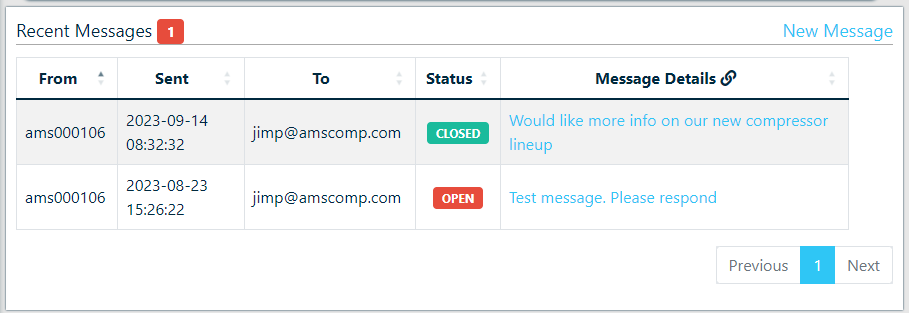
We have also updated the message preview link to open the selected message in a new browser tab.
PBX Integration
All customers who currently have an AMS VoIP solution deployed have had their PBX integration activated within the Cloud Platform. This means that all inbound and outbound calls to a customer's primary phone number will be available for review in both the CounterCRM and QuickDial modules, allowing you to confirm call volumes and duration for customers as well as confirm who a customer may have spoken with.
Additional CRM Updates
- Added new 'Total Owing' tile to the CRM 'Quick Statistics'
Custom Reporting - Purchasing data
We have imported ALL current and historic purchasing data into the custom report generator. This has resulted in the creation of 2 new types of custom reports
- Outstansding POs - These reports will pull from all current and outstanding purchase order data, linked into inventory data
- Purchase History - These reports will pull from all receiving data, linked into inventory data
- Supplier Data - All fields from your supplier screen is available on both purchasing reports.
Each of these reports contain all possible purchasing fields available as detailed fields, and basic aggregate fields under the calculated fields section.
QuickDial Updates
Overview
For CP2 users who also have implemented an AMS PBX VoIP solution, the Counterpoint Cloud Platform app has been updated with a number of enhancements around QuickDial.
The QuickDial integration module allows a tie-in between your phone system, the cloud platform and, in turn, the Counterpoint invoicing screen.
In an integrated scenario, a 'QuickDial' information page will pop up when you answer your phone, for the customer whose number is associated with the Caller ID. Within this page you get a number of key metrics
- Customer statistics like last payment, industry type, sales rep, account balances
- Month to date sales
- YTD sales graph, by month
- Current deliveries
- Detailed invoice history
You can also opt to launch an autoecat session as that user, or even launch a Counterpoint invoice session as that customer.
Update Details
The updates to QuickDial in this release are related to app security, performance and porting recent CRM updates into the QuickDial module.
As well, we have made enhancements to the handling of calls answered in 'fail-over' or call-center scenarios, where the call is being answered in a location different than the one it was originally destined for. These enhancements ensure that the Counterpoint session opened from the QuickDial screen is launched in the originally dialed branch
Windows Application
We have also released a new version of our Windows application. This utility allows you to launch the Counterpoint Cloud Platform right from your desktop!
The app is available for download here: https://counterpoint.cloud/app.php
Once installed, the application will auto-update with any future releases.
FlightDeck Inventory Dashboard
- We have updated both the Low Stock and Old Stock tables to consider product demand instead of only considering product sales.
- Modified the Old Stock table to include Supplier Code and Supplier Name, as well as changed the category field from Name to code.
Bug Fixes & Behind the Scenes Updates
- Fixed a bug when adding new notes to a customer
- Modifications to data export routines to address problems with items sold in tenths
- Modified the nightly 'non-stocked' import routine to apply the default product group from Category to non stocked items.
- Fixed a bug in the CounterCRM recent call log wherein only the most recent call was showing.
- Fixed code regression that caused JDispatch location and signature pop-ups to no longer work,
- Standardized the delivery detail screens between QuickDial and CounterCRM
- Fixed a bug causing the 'new note' button in QuickDial to work intermittently
- Fixed a bug that caused the current call badges in QuickDial to show with an incorrect style applied.
- Modified the flightdeck to remove unnecessary data metrics when viewing with an account applied
- Fixed a bug that was causing the CounterCRM "Monthly Sales By" graphs to show yearly totals vs monthly
- Enhanced the nightly export routines to better handle control characters within the product description.
- Fixed the Average Days Receivable tile as it was reporting invalid values.
V 1.4.5
Overview
This is a minor release based on some of the early feedback from version 1.4.4
Custom Reporting
We have imported the remaining supplier data as well as introduced another report type
- Supplier Sales - Similar to the customer sales, but tying Sales, Inventory and Supplier data
We have also imported some additional sales fields
- Bin Location
- Sell Price Level
- Discount at time of sale
Locked Items Report
A new report has been added to your CPMailer listing. The locked items report will report any items with a '*' locked price level assigned to them
Bug Fixes & Behind the Scenes Updates
- Fixed the historic sales report where the branch selection had been turned off
V 1.4.6
Overview
This is a minor release based on some of the early feedback from version 1.4.4
Custom Reporting
We have imported the remaining supplier data as well as introduced another report type
- Supplier Sales - Similar to the customer sales, but tying Sales, Inventory and Supplier data
We have also imported some additional sales fields
- Bin Location
- Sell Price Level
- Discount at time of sale
As well, the Inventory report has demand broken out by the last 12 months
New CPMailer Reports
- Locked Items Report: The locked items report will report any items with a '*' locked price level assigned to them
- Adjustments Report: The adjustments report will report any adjustments processed in the timeframe of your report
- Invoice Summary Register: A copy of the nightly Counterpoint invoice summary register
- Invoice Register: A copy of the nightly Counterpoint invoice register
New Prebuilt Reports
- Specials Report - Full listing of specials
- Items On Order Report - A copy of the Counterpoint Items On Order By Supplier report with a few additional fields.
- Adjustment History: A detailed listing of inventory adjustments
- Supplier Sales Analysis: A detailed analysis of items by supplier including sales, demand, purchase totals and values
- Customer Aging Report: A detailed customer listing with aging information as well as credit limit and current credit rating
- Buyer Sales Analysis: A detailed analysis of items by buyer including sales, demand, purchase totals and values
- Critical Inventory Report: A listing of items currently considered in a 'critical' state:
- Not enough inventory to last until the next order it set to arrive
- Out of stock and not on order
- Purchase orders past their required date
Bug Fixes & Behind the Scenes Updates
- Fixed the historic sales report where the branch selection had been turned off
- Corrected a situation where categories removed with the 'entire category delete' routine were not being dropped from the cloud platform
- Fixed the outstanding PO report for scenarios where data was not being returned
- Fixed bug that had the emailed lost sales report showing lost sales for the current period as well as the last comparative period.
- Fixed a bug in the Supplier sales analysis that only showed items with purchasing
Introduction and Getting Started
Some generic documentation for using the Counterpoint Cloud Platform with different devices.
Tablets and Phones
For the majority of Counterpoint Cloud Platform, your experience will be exactly the same as on your desktop computer. However, due to some of the features of these devices (touch input, smaller screen) there are a few differences between using the two devices.
All of these differences are documented here.
Mouseover Vs Tap
In the majority of the graphs we use what's known as mouseover effects to display more detailed data.
For example, the E-Cat Analysis module's Lookup By Day graph:
 When you move your pose over a data point, you get a small window telling you more information about that data point and its associated values.
However, your phone or tablet isn't likely to have a mouse connected to it - instead, you have to tap on the datapoint as you would a link or application in order to see the associated data. This means that you can have a mouseover effect active on multiple graphs at the same time, which isn't possible on a traditional mouse-based device. In addition, there are elements of these mouseover effects that aren't possible on a touch device. For example, underlining a link when you move your mouse over it - there is no action you can perform on a touch device that simulates moving a mouse over the link without clicking it, and therefore such actions aren't possible on your phone or tablet.
Additionally, although we try to make sure there is no information available on one system and not the other, there are some types of graphs that do not support showing mouseover effects on taps for these devices. Unfortunately, there is no workaround for us to show you that information at this time.
Small Screen Sizes
Although not officially supported, smaller screen sizes (typically 7 inches and smaller) will work for the majority of the Counterpoint Cloud Platform modules. If you do find yourself using a smaller touch device, it is recommended you use it in landscape mode wherever possible. Some of the elements we use (specifically, anywhere we user a table with many columns, or modals to display information.) struggle to shrink down for smaller screens, and are the main cause of these devices not being fully supported. It may not be possible to sort by some columns on these devices, due to their limited width.
CP2 App
While there is no Counterpoint Cloud Platform app available on your phone's app store, you can create one that takes you directly to your CP2 Home page.

- Open the Google Chrome browser on your phone or tablet.
- Navigate to the counterpoint.cloud website, and log in.
- Once you have logged in and the page has loaded, click the 3 vertical dots in the top right corner of your device, typically directly below the time display.
- Near the bottom of the list of items that is now displayed should be an option titled "Add to Home Screen". Select this option.
- Enter a name for the CP2 Application, or leave it with the default.
- Once you are happy with the name, click "Add".
- A message stating that the app "was added to your Home screen" will display, or an error message will show if creating the app was unsuccessful.
- Close your browser, and you should see your new Counterpoint Cloud Platform application on your screen, complete with familiar logo.
Supported Devices
Supported Devices
Officially, Counterpoint Cloud Platform supports any device that meets the following criteria:
- Is running the latest version of one of the following browsers:
2. Has a Viewport width of at least 1280.
This includes most devices with an 8 inch screen or bigger, made within the past few years. To check your viewport size, visit this site.
This means that we support the majority of desktop computers, and larger tablets. If you wish to use Counterpoint Cloud Platform on a device that does not meet these requirements, there is no hard requirement - some features may just fail to load, or display incorrectly.
FlightDeck
Documentation for the FlightDeck Module
FlightDeck Dashboard
Sales Filters

Along the top of the FlightDeck Dashboard is the display of your current data filters. This defines the branches, current configured sales period, previous comparative sales period and any specific customers. All information on the FlightDeck Dashboard is based off of these filters.
To modify the filters, you would click the Current Data Filters link, and the filter selections will slide down
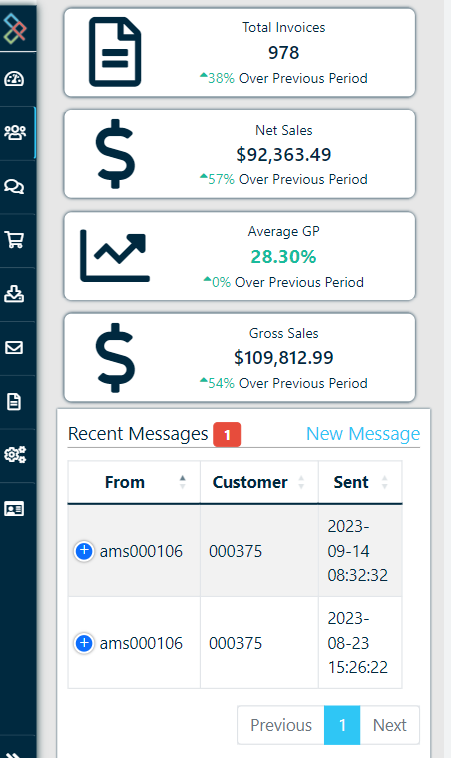
Sales Summary Tiles

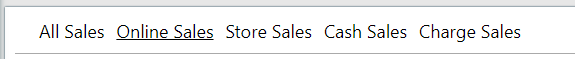
The FlightDeck Dashboard breaks down your sales into 6 metrics, which are filterable based on total sales, online sales, in-store sales, cash sales or charge sales
Note that the Net Sales value may be effected by online orders that were returned in store - currently there is no way for a return to be processed as having originally been purchased online.
Tile Values
Net Sales
The net sales tile is the total value of all products that were sold, minus the value of any items that were returned.
GP $
The gross sales tile is the total value of all products that were sold.
GP%
The Average GP% is calculated based on all sales tied to your Salesrep ID for the given month, where the total value of the invoice is greater than 0. This value is calculated by taking the value from the Total Sales tile, subtracting the cost of all the sold items, and then dividing by the Total Sales tile value.
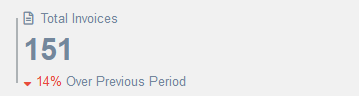
Total Invoices
The total invoices is calculated based on all sales tied to your Salesrep ID for the given month, where the total value of the invoice is greater than 0. For invoices with more than one line item each invoice number is only counted once.
Average Invoice Lines
The average number of lines per invoice is calculated based on the total number of lines processed for the given month, divided by the total number of invoices over the same period.
Average Invoice Value
The average invoice value is the sum of all invoices values for the given month, divided by the number of invoices over the same period.
Warning: If you start switching between the three different filters without giving the numbers the chance to recalculate successfully, it is possible to end up with a mix of values from the different filters.
Quick Account Stats
These are 3 tabs outlining some basic account based metrics
- Active Customers - Number of customers with sales within the set timeframe
- New Customers - Number of customers added to the system within the set timeframe
- Average Days of Receivables - Current average number of days receivables (does not adhere to the filters)

Sales Breakdown Graph
The Past Month Sales By Filter graphs give you a quick visual representation of the breakdown of your sales of the current period compared to last period, based upon the current data filters
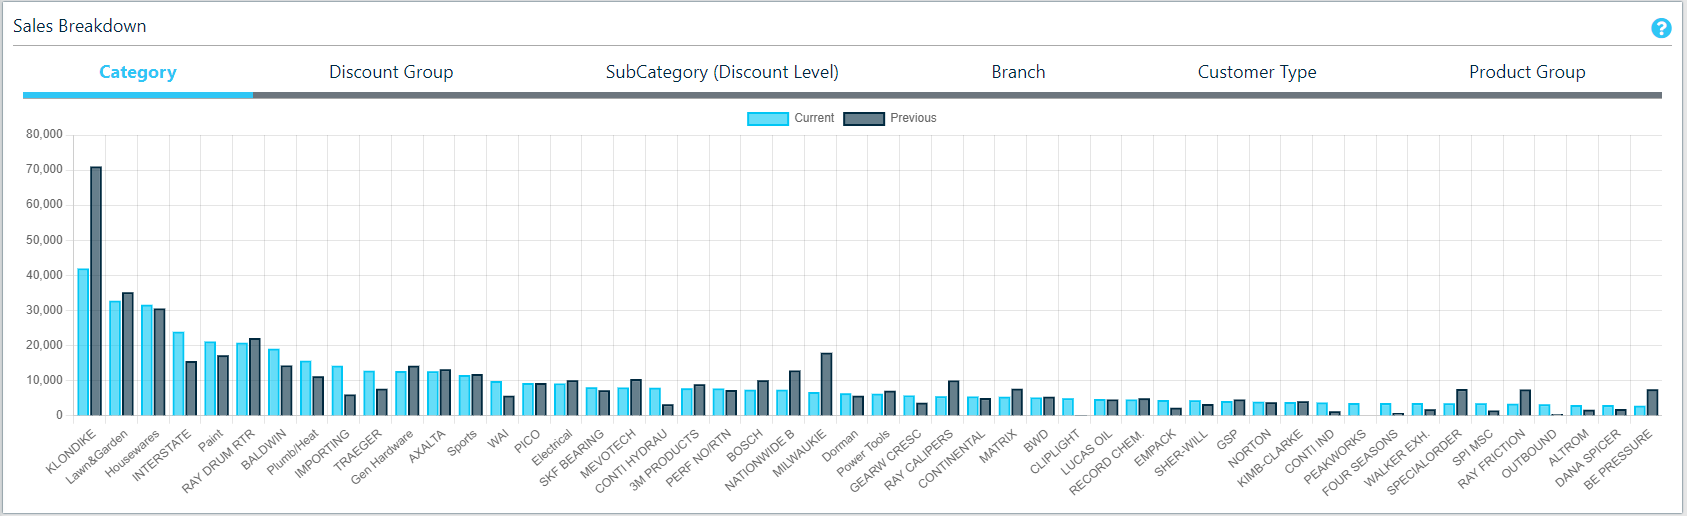
By Category
Filtering by category gives you a breakdown of your sales per category associated with a product.
Limited to top 25 Categories.
By Discount Group
Filtering by Discount Group, as defined within COUNTERPOINT.
By Class
Filtering by class gives you a breakdown of your sales per class associated with a product. Any sales involving products that do not have a class associated with them will not be represented by this graph.
Limited to top 25 Classes.
By Branch
Filtering by branch gives you a breakdown of your sales per branch associated with the sale.
By Industry
Filtering by industry gives you a breakdown of your sales per unique industry value you have assigned to customers via Counterpoint. If you have active customers that do not have an Industry value associated with them, those sales will not be represented by this graph.
Note that for all graphs some of the labels may not appear for given columns, depending on the size of your screen. To view the name for a column that did not appear, mouseover or tap either value from the column.
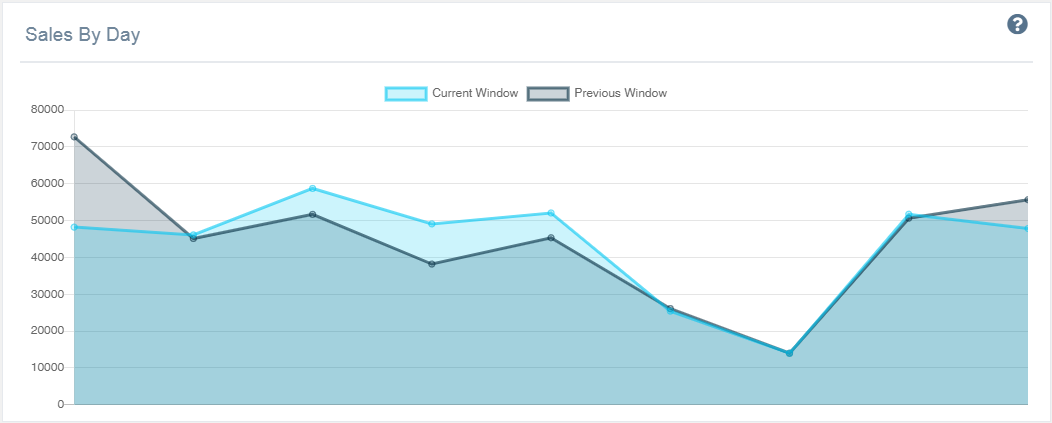
Sales By Day
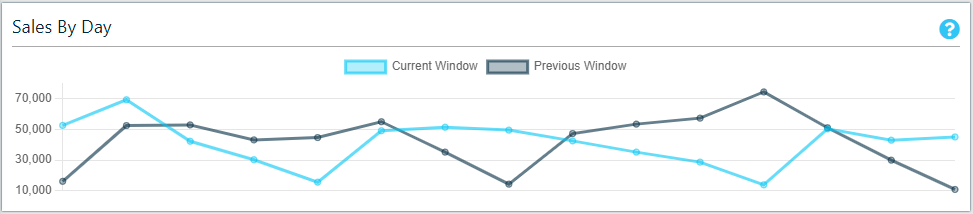
MTD Sales By Day shows all of your sales to date this month, on a daily basis. Each node on the graph represents a day this month, allowing you to easily spot patterns and irregularities in your sales.
Sales By Day is available as both a comparative and a cumulative chart.
Cumulative Sales

The cumulative sales graph shows the running total of sales over the specified period. This allows for a visual representation of any outliers that don't fit in with the sales trends over a longer period of time.
Top Customers
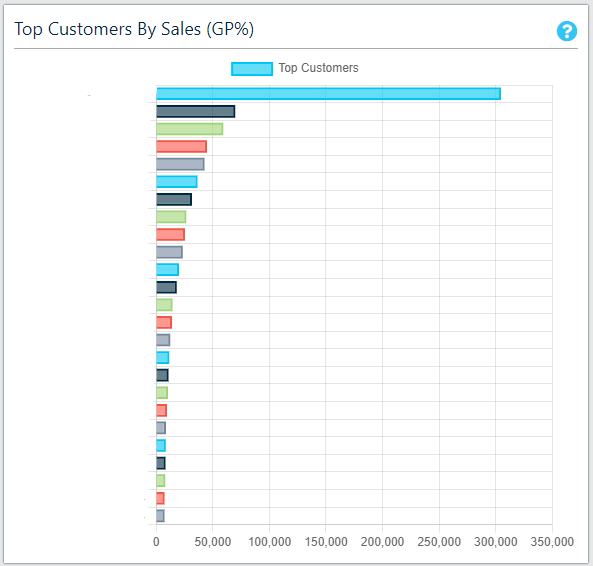
The Top Customers Chart shows your top 25 customers over the current period, based on total sales value.
In the event that one of these customers has a negative sales value, the graph will grow to the left, below the 0 value.
To display the exact value of the sales for a given customer, mouseover the coloured bar that represents the customer.
In the event that you are viewing a period for a specific customer, this graph will instead display as "Top Clerks" and display the top 25 clerks for sales made by the customer, over the current period.
Top Clerks By Sales
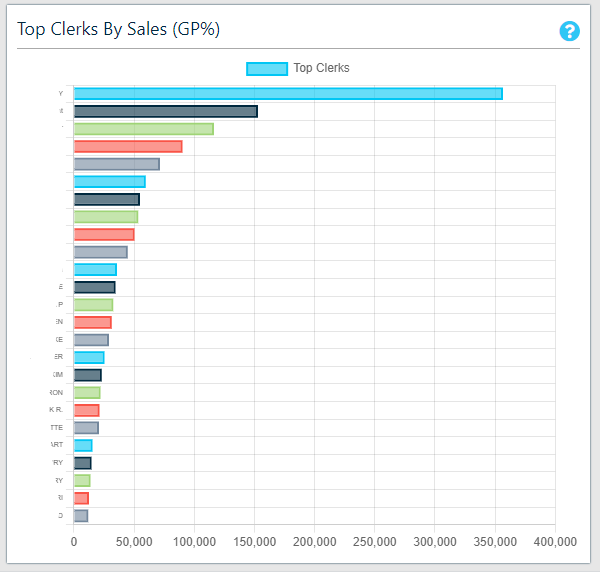
The Top Clerks Chart shows your top 25 clerks over the current period, based on total sales value.
In the event that one of these clerks has a negative sales value, the graph will grow to the left, below the 0 value.
To display the exact value of the sales for a given clerk, mouseover the coloured bar that represents the clerk.
Top Sales By Rep
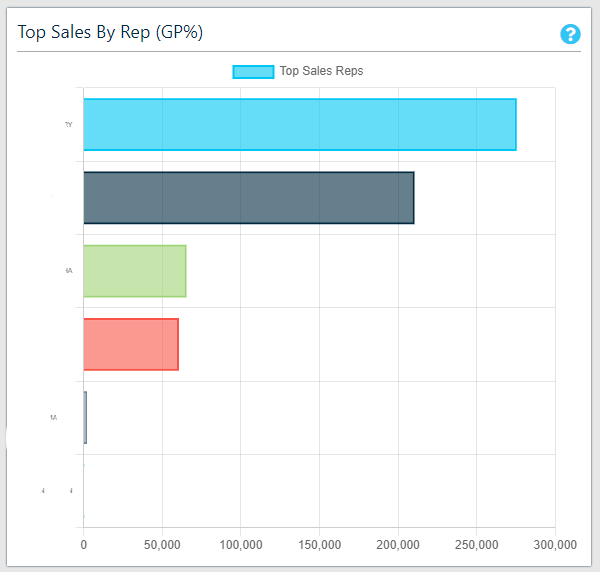
Top sales by rep shows your sales by sales rep. Hovering over the bars will display the detailed total sales figure
Monthly Sales History
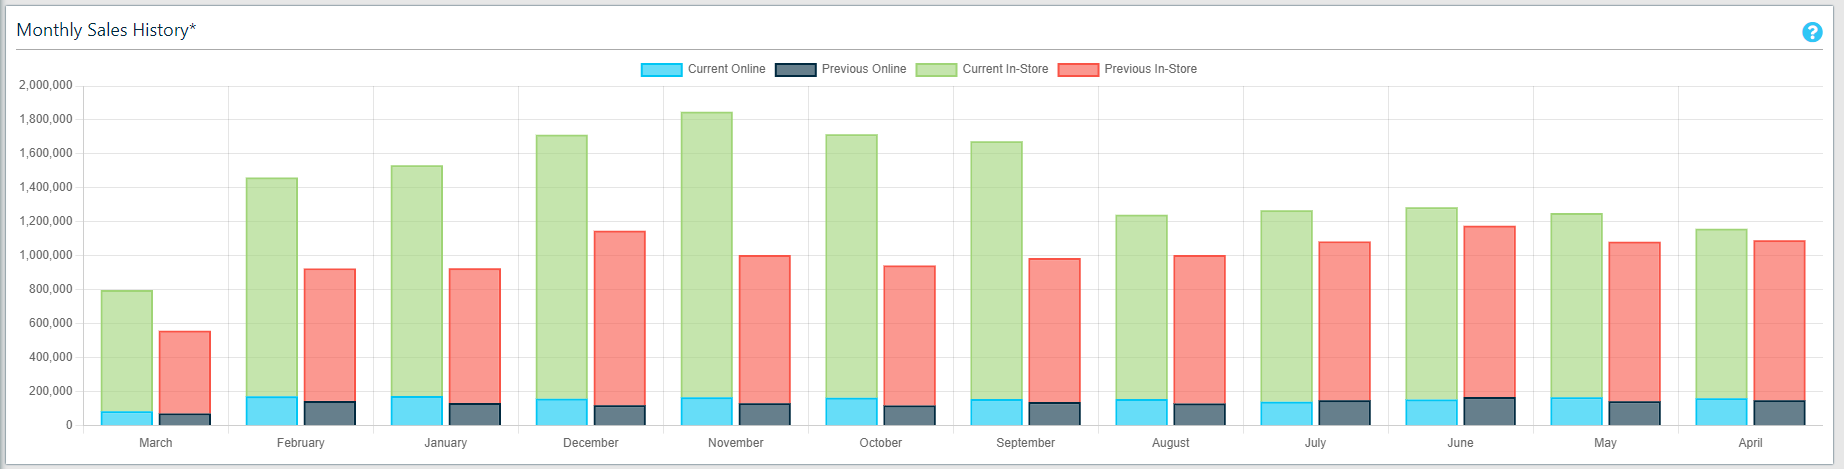
This graph shows the past 12 months sales, by month, compared to the previous year in a stacked graph showing online and in-store sales.
Inventory Dashboard
The inventory dashboard gives you an overview of the value and breakdown of your inventory, on a per-branch or aggregate basis.
Window Switcher
The window switcher for the inventory dashboard allows you to select one or more of your branches to load the inventory data from.
Inventory Summary
The inventory summary consists of 4 tiles offering at-a-glance stats about the inventory data you have loaded. This includes:
- Inventory Cost
Sum of Average Cost * Quantity, per part
- Forecasted Annual Turns
Sales over past 12 months vs current value of inventory
- Currently Stocked Items
Unique count of items with stock > 1
- Items With Invalid Stock
Unique count of items with stock < 1
Inventory Breakdown Graphics
Inventory for the current window is broken down into "top 10" graphics, categorized by:
- Category - Your system's internal linecodes
- Branch - Your configured branch locations
- ACA Category - Product classifications based on product vehicle fitment and the autocare association ACES standard.
- Old stock by category
Aged Inventory Summary
The inventory summary consists of 4 tiles offering at-a-glance stats about your inventory and it's aged valuation
- Current Stock
Items that have been sold or added in the past 12 months
- 12 Month Stock
Items that have not been sold in the past 12 months, but have been sold in the past 24 months
- 24 Month Stock
Items that have not been sold in the past 24 months, but have been sold in the past 36 months
- 36 Month Stock
Items that have not been sold in the past 36 months
Monthly Inventory Value
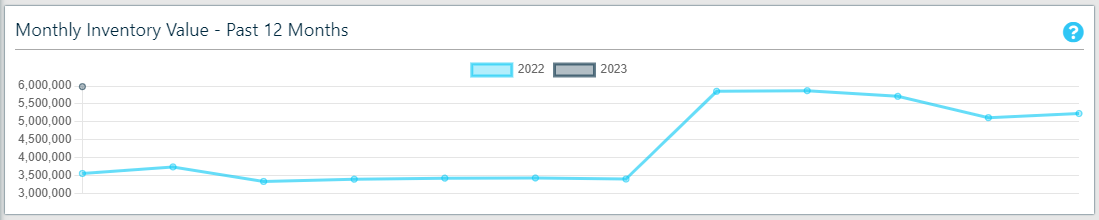
Displays the monthly inventory value (at average cost) by month for the past 12 months
Inventory Status
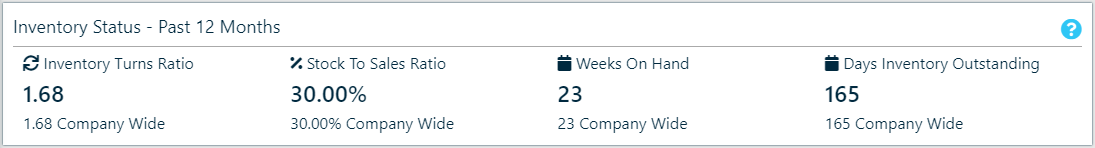
4 additional inventory status metrics
- Inventory Turns Ratio - calculated by dividing the cost of goods by average inventory for the same period.
- Stock To Sales Ratio - Average stock value / Net sales value
- Weeks Inventory Onhand - Accounting Weeks in Period / Inventory Turnover Rate
- Days Inventory Outstanding - (Average inventory / Cost of sales) x Number of days in period (365)
Historic Inventory Status
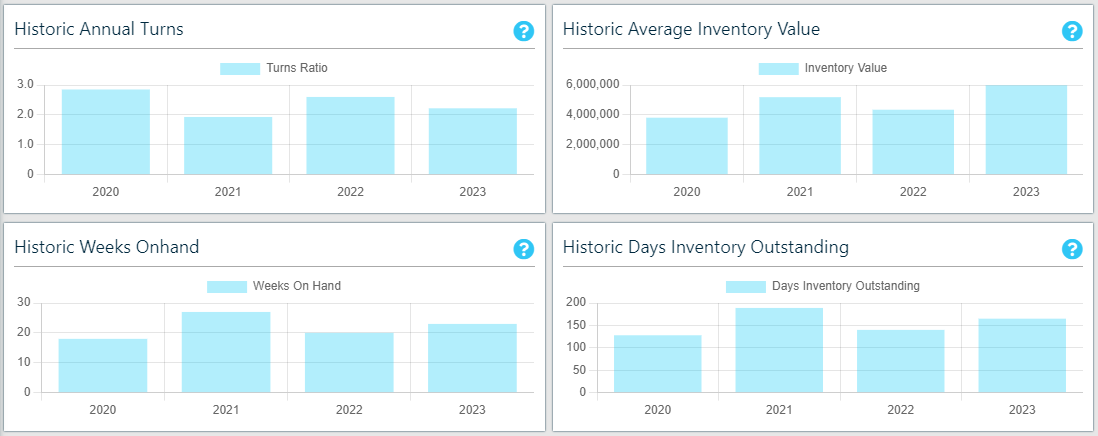
A set of 4 graphs displaying the historic values for the 4 inventory status metrics:
- Inventory Turns Ratio - calculated by dividing the cost of goods by average inventory for the same period.
- Stock To Sales Ratio - Average stock value / Net sales value
- Weeks Inventory Onhand - Accounting Weeks in Period / Inventory Turnover Rate
- Days Inventory Outstanding - (Average inventory / Cost of sales) x Number of days in period (365)
By year, for the past 3 years
Inventory Low Stock
The Inventory Low Stock table lists all of the parts within the current window that have what we consider to be "low stock". By default, the low stock threshold is (On Hand + On Order) < (Sold Last 12 Months / 24). Or in other words, you have lower stock between On Hand and On Order than you are expected to sell over half a month.
Inventory Old Stock
The Inventory Old Stock Table lists all of the parts within the current window that have not been sold in the past 24 months, as well as the quantity and overall inventory value of the parts.
Goals
Goals offer a way to visually see progress towards a long term target, focused on either a month-end or year-end value.
Goals Summary
The goals summary page shows all of your current, non-completed goals and their progress split up based on whether they are specific to you or company wide.
Clicking on the name of a specific goal takes you to that goal's breakdown, showing your current progress and target as well as a monthly breakdown for annual goals.
Pressing the View/Edit Goals button in the top right takes you to the goal listing, where you can mark goals as primary, create new goals, and view completed goals.
Goal Diagram
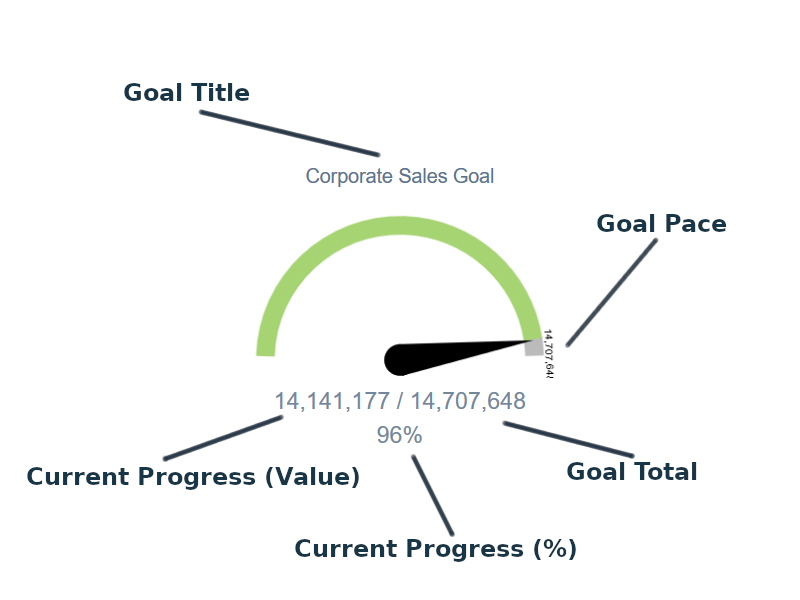
Goal Title
The title of the goal set when it was created.
Current Progress (Value)
Your current progress towards the goal over the duration of the goal so far.
Current Progress (%)
Your current progress towards the goal over the duration of the goal so far, as a % value of the goal total.
Goal Total
The total value the goal is set for.
Goal Pace
The calculated value of how far along in your goal you should be at its current state, if you are to achieve the goal by its completion date.
This is calculated by: ((Days elapsed towards goal / Total days in goal) * Goal Total)
In the picture above, the goal has completed - therefore the goal pace is ((365 / 365 ) * 14707648).
CounterCRM
Customer Lookup
Overview
The Customer Lookup provides you with a sortable, searchable table of customers that you are the salesrep for. From this table, you can enter the CounterCRM module for any one customer at a time by clicking on their Customer Number.
From within a customer's CounterCRM module, you can return to the Customer Lookup to select another customer's data to load.
Only customers that you have been appointed the Salesrep for will show up in this table.
Targeted Customers
This is the initial customer listing view and contains a complete list of customers assigned to a user's sales rep ID (or, all customers if viewing as an admin user) whose accounts have been flagged for one of 5 reasons
-
 - These customers have been manually flagged to show in the targeted listing.
 -
 - These customers have a 30 day balance owing that exceeds the max allowable 30 day balance.
 -
 - These customers have a 60 day balance owing that exceeds the max allowable 60 day balance.
 -
 - These customers have a 90 day balance owing that exceeds the max allowable 90 day balance.
 -
 - These customers have a percentage sales decrease greater than the max allowable sales decrease.
All max values can be set in the CounterCRM maintenance and will default to the values set at a sponsor level in CP2 Admin > Server Settings
All Customers
This is a listing of all customers assigned to the user's sales rep ID. If the user is a manager level user, then it will be all customers assigned to sales reps for which they are the manager. Admin users can see ALL customers
Dashboard
Customer Summary
The Customer Summary currently offers 12 quick glances at your sales with this customer on a month-over-month basis. Each one of these stats is referred to as a "tile", and appear in numerous places throughout Counterpoint Cloud Platform
All "% From last month" values are calculated up to the current day of the month.
For example: if today is July 15th, the main values are calculated based on sales from July 1st to July 15th, while the "From last month" values are calculated based on sales from June 1st to June 15th.
Because of this, you may see fluctuations throughout the week as the number of business days elapsed in a month will differ as weekends occur.
Customer
Displays the customer's account number and the name associated with it.
Sales Rep
Displays the name of the sales rep associated with this customer. If there is no Counterpoint Cloud Platform user associated with the sales rep number, the number is displayed instead.
Total Invoices
The total number of invoices that have this customer associated with them from the start of the current month.
Net Sales
The total sum of the values of the invoices (less returns) that have this customer associated with them from the start of the month.
Gross Sales
The total sum of the values of the invoices (before returns) that have this customer associated with them from the start of the month.
Last invoice
Amount and date of the last invoice for this customer
Last Payment
Amount and date of the last payment this customer made
Credit Limit
Credit limit set in Counterpoint for this customer as of last night.
Avg GP%
The GP from all of the invoices that have this customer associated with them from the start of the month.
Online Sales
The total sum of the values of the invoices that have this customer associated with them from the start of the month, and have autoeat associated with them as the clerk.
Industry Group
If applicable, the industry group that this customer belongs to. Otherwise, will display as "N/A"
Discount Group
Displays the discount group that this customer belongs to.
Credit Rating
Credit rating within Counterpoint as of last night
Current
Displays the outstanding balance that this customer is carrying.
30 Days
Displays the outstanding balance that this customer is carrying from 30 days ago.
60 Days
Displays the outstanding balance that this customer is carrying from 60 days ago.
90 Days
Displays the outstanding balance that this customer is carrying from 90 days ago.
Customer Actions
Create Order
View Customer In FlightDeck
Open the active customer in the FlightDeck Dashboard tab, with all dashboard metrics only applying to this customer
Add Customer to Focus
View Notices
View any current notes assigned to this customer
Monthly Sales History
A graph that is a month by month breakdown of the customer's sales used to quickly highlight sales trends. The graph is a stacked bar graph that will represent both in store and online sales, comparing them to the previous year.
Recent Activity
The recent activity panel gives you a quick glance at some of the different items that can be associated with a customer - notes, messages, calls, and alerts. Any tabs with active or unread messages will have an alert box next to the heading with the number of open items contained within.
Recent Messages
Shows up to 4 of the most recent messages associated with the customer. Also shows the number of unanswered messages as a badge on the Recent Messages button.
Offers quick access to the message creation screen and auto-fills the Customer ID value through the "New Message" link in the top right of the panel.
Recent Notes
Allows you to see up to 5 of the most recent notes associated with this customer, as well as who created them and their timestamp.
Offers quick access to the Notes page via the "Create Note" link in the top right of the panel
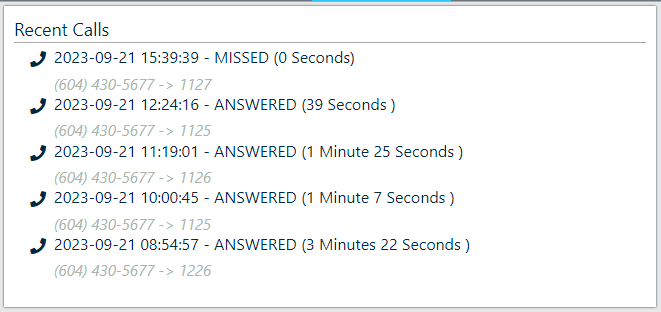
Recent Calls
Shows the three most recent calls with the phone number stored in this customer's profile. Offers the start date, end date, and time elapsed for the phone call.
For a more detailed breakdown of all calls, the "Go to full Call Log" link is located in the top right of the panel.
This section is only available to those who are utilizing a phone package from AMS.
Customer Alerts
The customer alerts section shows a list of all of the conditions in which an alert can be triggered for a customer. The sum of the number of alerts is shown as a badge on the Customer Alerts button.
Any values that are configurable on a per-customer basis are editable via the "Edit Customer Alerts" button in the top right of the panel.
If enabled, on the first of the month, a report will be emailed to the address associated with your sales rep account detailing all of the customers who triggered alerts.
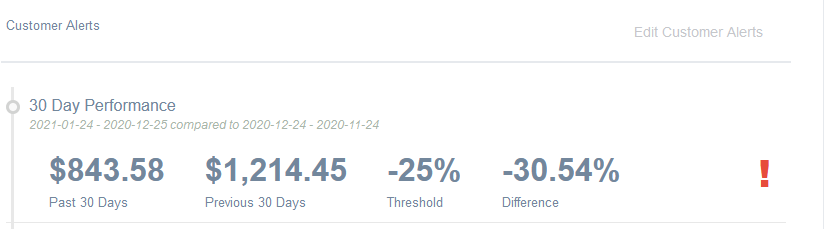
30 Day Performance
This alert tracks the total value of sales for the last full month, and compares it to the previous month. If there is a decrease in sales greater than the threshold value, an alert is generated.
The threshold value can be changed on a per-customer basis via the "Edit Customer Alerts" link in the top right of the panel, and falls back to a global value that can be changed in the server settings.
Account Debts
These alerts track the total debt for a customer over 3 values (30, 60, 90 days) and generates an alert for each if the value is greater than the threshold. The threshold for each of the 3 potential alerts can be changed in server settings.
Uploaded Files
Displays any files specifically uploaded for this customer
Past Month Sales By ACA Category
The Past Month Sales By Class graphs give you a quick visual representation of the breakdown of your sales so far this month, compared to this day of last month for the given customer.
This graph relies in the Class that is associated with each product. Any products that have been sold to this customer that do not have class values associated with them will not appear in this chart.
If you have had any returns made in a different month from the original purchase, it is possible for some classes to have negative values. This will shift the range of values that the chart displays.
Past Month Sales By Category
The Past Month Sales By Category graphs give you a quick visual representation of the breakdown of your sales so far this month, compared to this day of last month for the given customer.
This graph relies on the values associated with the categories for each product. As categories consist of a 3 character ID in Counterpoint, that code will be displayed for each value here.
If you have had any returns made in a different month from the original purchase, it is possible for some categories to have negative values. This will shift the range of values that the chart displays.
Online MTD Sales Summary
These statistics are pulled directly from autoecat.com.
Summary Tiles
These tiles represent some specific values as they pertain to the current user's online browsing and buying habits
autoecat Lookups By Month
This is a total of the number of autoecat lookups this user made, broken down by month for the past 6 months.
Top Lookups by Product Line
This is a total of the number of autoecat lookups this user made, broken down by the catalogue defined product types based on the autocare ACES standard
Last Catalogue Access
The last date this customer logged into autoecat
MTD Lost Sales
A total count of the number of online lost sales that have been registered to this account. This does include automated lost sales triggers.
Sales Summary By Filter
The Sales Summary By Filter Table allows you to drill into the sales of a customer, offering monthly and yearly comparisons.
Columns
The following columns are present in every table under this panel:
MTD Sales
The total value of all sales for this row so far this month.
MTD $ Difference ($ Diff.)
he difference in sales so far this month compared to last month.
MTD % Difference (% Diff.)
The difference in sales so far this month compared to last month, as a percent value.
MTD GP%
The gross profit so far this month, as a percent value
MTD GP% Difference (Diff.)
The difference in gross profit so far this month compared to last month, as a percent value.
MTD% Returns ($ Ret.)
The number of items that have been returned this month compared to the number of items that have been bought this month, as a percent value
YTD Sales
The total value of all sales for this row so far this year.
YTD $ Difference ($ Diff.)
The difference in sales so far this year compared to last year.
YTD % Difference (% Diff.)
The difference in sales so far this year compared to last year, as a percent value.
YTD GP%
The gross profit so far this year, as a percent value
YTD GP% Difference (Diff.)
The difference in gross profit so far this year compared to last year, as a percent value.
YTD% Returns (% Ret.)
The number of items that have been returned this year compared to the number of items that have been bought this year, as a percent value
Tables
The following tables are available within this Sales Summary By Filter panel
Category
A listing of each category that has been sold to the parent customer with the category and description available. Drills down on the "Category" column.
Category > Part
A listing of each part that belongs to the parent category, that has been sold to the parent customer with the item code and description available.
ACA Category
A listing of all the available ACA categories for which you've sold a product within the current time frames, with the category and description being available. Drills down on the "Category" column.
ACA Category > ACA Subcategory
A listing of all the available ACA subcategories related to the parent ACA category for which you've sold a product to a customer within the current time frames, with the SubCategoryID and SubCategory Name available. Drills down on the "SubCategoryID" column.
ACA Category > Category
A listing of all your product categories for which a product has been sold to the customer that matches the parent ACA Category within the current time frame.
Class
A listing of all the classes for which a product has been sold to this customer, within the current time frames.
Class > Subclass
A listing of all the subclasses related to the parent class for which you've sold a product to a customer within the current time frames, with the subclass name available.
Customer Notes
The CounterCRM Notes section allows you to read and write notes on a per-customer basis that integrate back into the note system you already know from COUNTERPOINT.
Receiving Notes
Every night as part of the data processing procedure, a copy of all the notes from COUNTERPOINT are loaded into the Counterpoint Cloud Platform database. From here, we display the notes for a customer on both the dashboard portion, and the notes portion of the module in their original form. This includes the name of the person who creates the note, the time it was created at, and the contents of the note.
If a note is created in COUNTERPOINT in the middle of the day, it will appear on the Counterpoint Cloud Platform after the nightly data processing procedure has occurred.
Creating Notes
Creating notes can be done from the "New Note" button on the notes page of the CounterCRM module. Here you have a form to create a note with which is then passed back to Counterpoint, usually within 5 minutes.
To maintain compatibility with COUNTERPOINT, there are some limitations set on the length and style of the note you can create. When creating a note, keep the following in mind:
- Your note is limited to 3 lines
- Each line is limited to 72 characters
- If a line exceeds 72 characters, it is broken into 2 lines
While the Counterpoint Cloud Platform attempts to modify your note to fit these requirements, there are a few cases where it will be unable to do so, and you will receive an error while trying to create your note.
Call Log
The Call Log page displays all recorded calls between your phone system and the phone number associated with the customer when your integration with a COUNTERPOINT Unified Communications platform is enabled.
Each entry in the call log includes the phone numbers involved, the duration, the disposition, and the date. Optionally, if you chose to include extended storage for call logs in your COUNTERPOINT Unified Communications platform a link to recording of the call will be available.
Note that in certain conditions, it is possible for a lengthy call to have a disposition of "MISSED". This usually occurs when a transfer is involved (to a parking spot, or otherwise) and the customer hangs up. Unfortunately all "MISSED" calls are assigned a talk time of "0 Seconds", which is misleading.
The "Call Log" panel can be accessed from either the CounterCRM module, or through QuickDial.
If you believe there is an issue with your Phone System, it may be better to contact AMS with your question for assistance with looking into your phone logs.
Counter Message
Creating a Message
Creating a message in the Counter Message system is straight forward. In order to create a new message, you need two pieces of information: an email address to send the message too, and a message to send. Optionally you can provide a customer account number to tie the message to a specific customer and have it show up in their CounterCRM module.
Customer ID
This is the optional value you need to input to tie a message to a specific customer. Typically this number is a 6 digit value, and can be found from a customer's CounterCRM page, or the drilldown page on your FlightDeck Dashboard.
Alternatively, visiting a CounterCRM dashboard and navigating to the Recent Messages tab of the Recent Activity panel, you can use the "New Message" link in the top right corner of the panel to be brought to the New Message page with the customer's ID already filled out.
To
The To: field is the same as it is for a standard email. To send a message to multiple email addresses, separate them with a semicolon ( ; ) like so:
alice@company.com; bob@company.com; charles@company.com
Alternatively, your administrator has the option of populating an address book with predefined names and email addresses for your convenience. By clicking the "Show Address Book" option you can select rows from the table displayed and add them to your message.
Message
This is where the content of your message goes. This is the same as writing the body of an email, where whatever information or request you're sending needs to go.
Response Alert
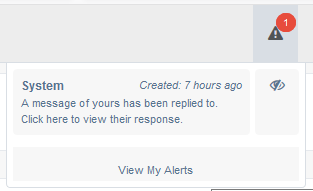
When somebody replies to a message you have sent, a system alert is generated within the Counterpoint Cloud Platform. From the alert you can view the message and see who responded, and the message they sent back.
Receiving a Message
When a message has been sent to you, you'll receive a generated email with a link to view the message on the counterpoint.cloud website.
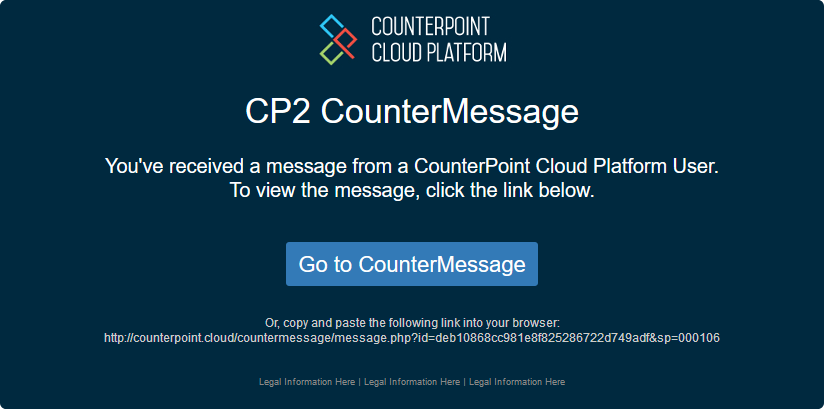
With this email, you can click the "Go to CounterMessage" link if your email client supports links. If not, you'll have to copy and paste the text below the link into your browser to view the message.
Response Screen
Once you've either clicked the link or copied it into your browser, you can view the actual contents of the message. If you are the only recipient of the message and you have no yet replied, the bottom of the screen will allow you to provide an identity and response message.
However, if the message was sent to multiple people, only one person is able to reply. Therefore, you may see that someone has already replied, and the identity/message that they chose to respond with.
Active and Archive Lookups
The active and archive lookup links allow you to view a history of messages you sent that are either still active (no reply) or archived (replied to).
These tables allow you to filter by any of the available columns, and default to the most recent messages first.
To view a message, you can click on the message preview to be taken directly to the message screen. In the event that someone has lost the link to your message, you can take the URL from your browser and send it to them however you like, so that they may see the message and respond.
E-Cat Analysis
E-Cat Analysis Page
Overview
The ecat analysis page is a representation of browsing trends on autoecat.com as of the previous day.
MTD Summary
These are month to date sales and browsing totals from autoecat
Online Invoices
A total number of invoices processed by your online clerk(s).
Online Sales
Total sales attributed to your online clerk(s)
Online GP%
Gross profit percentage of all month to date invoices done by your online clerk(s)
Active Users
Number of customers who accessed autoecat in the past month
F6 Lookups
Number of autoecat lookups started via the F6 shortcut in the Counterpoint invoice screen
Remote Lookups
Number of autoecat lookups done by your remote users
Top Web Customers
This is a graph representation of the customers who processed the most dollars in online sales, using your online clerk(s) to determine sales dollars
Top Web ACA Category
This is a graph representation of the top sales by product type. This calculation is based off of sales processed by your online clerk(s), and then comparing the parts sold to the part classifications within autoecat.com
Lookups Analysis
This is an interactive set of graphs that will enable you to drill down to see browsing trends for specific year/make/model of vehicles. These figures default to a MTD view, but can optionally be set to YTD.
All three graphs are interactive and, as you click each graph, the other graphs in the panel will update to use your selection to drill down.
Lost Sale Listing
This is a complete listing of moth to date lost sales.
Resource Centre
Downloading and Uploading Files
The Resource Centre module allows you to upload and download resources, as well as download resources that other people have marked as public within your company.
Uploading

To upload a file you have two options - you can either drag and drop the file from your computer onto the gray box on the screen, or click the "Browse" link to view the files on your computer.
Once you have selected a file to upload, you'll be able to see the status of the upload while you transmit the file. At this time you can select more files to upload, or wait for the existing files to finish.
Note that if you try to submit a file while it is still uploading, the upload will fail.
Once all your files have finished uploading, pressing the Submit button will process the files and refresh the page. From here, the files you just uploaded should be available.
To mark a file as public, add a description, or change the Public/Private setting of a file, click anywhere on the row for the file within the table. This gives you 3 different options for actions you can perform against the file.
Note that files are stored based on their file name. That is, if you have a file called notes.txt and upload another file called notes.txt, the original file will be replaced and is not recoverable.
Downloading
One of the up to 3 options you'll see when you click on your own file, or the only option you'll see if you click on someone else's public file is the download option. Clicking this will start the download to your browser, and save the file to your computer.
Unfortunately, at this time we force the download to your computer before you can open it, so pdf files will not open immediately in a new tab.
CPMailer
Managing your own CPMailer reports
The CPMailer Core is the base module within the CPMailer. This module allows you to manage your own personal reports. As of V1.4, the CPMailer core underwent an update to how reports can be built. Reports are sent on a Nightly/Weekly/Monthly basis and are sent in 'blocks' within an email. So, one email can potentially have all possible reports, or you could generate a number of emails with specific types of reports in each.

Creating New Reports
To generate a new report email, click the Create Report button

The creation of the report has 3 steps:
- First, select a name for your new report email. This can be anything you like.
- Pick a frequency which this email will come. Daily/Weekly/Monthly reports need to be created individually.
- Pick the reports you wish to appear on the email.
Once the report is generated, it will be actioned to send on the next potential cut-off.
Editing / Removing Reports
To edit or delete a report, click on the report you wish to manage from the CPMailer Core page.

You can edit any of the fields and click Submit, or just click Delete Report to delete the report email
User Reports
Lookup Table
The user reports page displays a list of all the users and their associated email addresses, as well as any daily/weekly/monthly report blocks they are currently setup to receive.
From this table you can click on a user to edit their daily, weekly, or monthly report blocks. Additionally if they are a CPMailer user, they can be deleted.
CPMailer Users
CPMailer users represent email addresses that you wish to send reports to, but are not associated with an account on the COUNTERPOINT Cloud Platform. These users can be created freely and carry no additional charges or fees, however they are not real users in the sense that they are unable to log in, and do not exist outside the CPMailer module.
Editing User Reports
Editing a user report allows you to select one or more blocks from predefined lists, in order to build a report of the information this user will find necessary or useful. As you select blocks, the report preview will populate and give you a glance at what the report may look like - however the blocks and their shapes are not accurately represented here.
There are currently 2 different types and subheadings of report blocks:
Summary Blocks
Summary blocks are sorted by a relevant value (total calls, net sales, etc.) and limited to a total of 5 rows. This is handy if you want a quick glance at how your top performers are doing, without all the length that comes with the detailed blocks. Additionally, should you decide that you do want to look at the entire information set, it is attached to the generated report as a .csv file which should open in any standard spreadsheet program.
Detailed Blocks
Detailed blocks typically hold the same information that the attachments from summary blocks do - all of the information generated for a specific report block. For large companies, these blocks can grow to be quite large and it may be smart to limit how many of these make it into a user's report.
Special Reports
Special reports allow the generation of reports that don't fit into the block/frequency model of user reports. These reports are typically only configurable by on/off, and require additional calculations to send.
Customer Alert Report
The customer alert report polls every customer in record and checks it against predefined conditions, raising an alert if the values or calculations exceed a threshold. Using this, it is possible to send each Salesrep a list of all their assigned customers which triggered an alert at the end of the month.
These should be the same calculations found under the CounterCRM module, in the Recent Activity > Customer Alerts tab.
Adding Users & Reports
Log into the cloud platform and navigate to the CPMailer > User Reports
If this is a new user, they must first be added as a specific 'Report only' user.
If this is not a new user, or once you add the user, click the users row in the listing table and you will be given a few options. (Note, that the current reports that the user gets are listed in the table)

You can select to edit Daily/Weekly/Monthly reports. In this instance, we wanted to change the weekly reports, so we click on the button.
This will take you to a screen with the optional reports for the user. Here you can select the reports you want to send. The preview on the right will adjust as you add/remove reports.
Report Generator
Creating Reports
The report generator is a very powerful tool allowing you to pull your own reports based on the data available. However, this power comes with increased complexity. Although this documentation may seem long, it aims to unlock your ability to generate your own reports and pull information that otherwise isn't currently accessible to you in a meaningful way.
Report Type
The first option in the report generator is the report type. There are currently two types of reports available:
-
Sales
- Inventory
These different types of reports change the available data you can pull from when building your report.
Static Columns
Once you've selected a report type lists of column names will appear, depending on which report type you selected. Each column will have a different title, based on the data associated with the report type.
These columns represent the unique values you want to appear in your query. For example, if you were to select Account Number from the customer columns for a sales report, you would get one row for each account number. However, if you select both Account Number from the customer columns and Category from the item columns, you'll get one row for each category each customer has sales for.
Aggregate Columns
Aggregate columns are the values that require calculations to be made. This is where most of the information you'll come looking for lives.
Currently there are 4 types of aggregate columns:
- SUM( ) - The sum of all the values in the rows of the data, that make up one row of your report
- AVG( ) - The average of all the values in the rows of the data, that make up one row of your report.
- COUNT( ) - The number of values in the rows of the data, that make up one row of your report.
- CALC( ) - Special values that are calculated based on predetermined formulas.
Date Range
The date range allows you to specify a date range for the data in your report, if applicable.
For inventory reports these fields are still present, however the inventory data has no date associated with it. Therefore changing these values will have no effect.
Static Column Filters
Static column filters allow you to filter your results based on the static columns. For example, if you wanted all the categories that customer '123456' has sold, you would select both the Account Number and the Categories columns, and then filter based on Account Number is equal to 123456.
Note that in order to have a column show up in a filter, the filter must be created after the column is selected. If you don't see the column you wish to filter on and you are sure its selected, remove the filter and add a new one.
Prebuilt Reports
Prebuilt reports offer additional reporting options that do not fit into the capabilities of the standard report generator. These reports are typically requested by one customer, and then made available to everyone.
Currently, the following prebuilt reports are available:
- Sales Table
- Historic Sales
- Historic Inventory
Sales Table
The sales table report used to be featured on the FlightDeck Dashboard. However, the report takes considerable time to load properly, and was slowing down the performance for everyone as the FlightDeck Dashboard is a main landing point for many users.
The Sales Summary By Filter Table allows you to drill down into your sales for the past month, offering monthly and yearly comparisons across your sales.
Columns
The following columns are present in every table under this panel:
MTD Sales
The total value of all sales for this row so far this month.
MTD $ Difference ($ Diff.)
he difference in sales so far this month compared to last month.
MTD % Difference (% Diff.)
The difference in sales so far this month compared to last month, as a percent value.
MTD GP%
The gross profit so far this month, as a percent value
MTD GP% Difference (Diff.)
The difference in gross profit so far this month compared to last month, as a percent value.
MTD% Returns ($ Ret.)
The number of items that have been returned this month compared to the number of items that have been bought this month, as a percent value
YTD Sales
The total value of all sales for this row so far this year.
YTD $ Difference ($ Diff.)
The difference in sales so far this year compared to last year.
YTD % Difference (% Diff.)
The difference in sales so far this year compared to last year, as a percent value.
YTD GP%
The gross profit so far this year, as a percent value
YTD GP% Difference (Diff.)
The difference in gross profit so far this year compared to last year, as a percent value.
YTD% Returns (% Ret.)
The number of items that have been returned this year compared to the number of items that have been bought this year, as a percent value
Tables
The following tables are available within this Sales Summary By Filter panel
Customer
A listing of each customer you have sold a product to in the current time frames, with their account number and name available. Drills down on the "Account" column.
Customer > Category
A listing of each category that has been sold to the parent customer with the category and description available. Drills down on the "Category" column.
Customer > Category > Part
A listing of each part that belongs to the parent category, that has been sold to the parent customer with the item code and description available.
Item Category
A listing of all the item categories you have sold within the current time frames, with their category and description available. Drills down on the "Category" column.
Customer Territory
A listing of all the territory values for which you've sold to a related customer within the current time frames, with the territory value available. Drills down on the "Territory" column.
Territory > Customer
A listing of all the customers for which you've sold a product in the current time frame belonging to the parent territory value, with the account number and name available.
Industry Code
A listing of all the industry code values for which you've sold to a related customer within the current time frames, with the industry code available. Drills down on the "Industry Code" column.
Discount Group
A listing of all the discount group values for which you've sold to a related customer within the current time frames, with the discount group value available. Drills down on the "Discount Code" column.
Discount Group > Customer
A listing of all the customers for which you've sold a product in the current time frame belonging to the parent discount group value, with the account number and name available.
ACA Category
A listing of all the available ACA categories for which you've sold a product within the current time frames, with the category and description being available. Drills down on the "Category" column.
ACA Category > ACA Subcategory
A listing of all the available ACA subcategories related to the parent ACA category for which you've sold a product to a customer within the current time frames, with the SubCategoryID and SubCategory Name available. Drills down on the "SubCategoryID" column.
ACA Category > Category
A listing of all your product categories for which you have a sold aproduct that matches the parent ACA Category within the current time frame.
ACA Category > ACA Subcategory > Products
A listing of all the products associated with the parent ACA subcategory for which you've sold to a customer within the current time frames, with the item code and description available.
Class
A listing of all the classes for which you've sold a product to a customer within the current time frames, with the class ID and class name available.
Class > Subclass
A listing of all the subclasses related to the parent class for which you've sold a product to a customer within the current time frames, with the subclass name available.
Historic Sales
The historic sales report focuses on a particular branch, and offers an overview of sales performance for the past 2-3 years. This includes gross income, net income, and GP% broken down by year and by month.
This double breakdown of by year by month isn't available via the standard report generator, and doesn't play nicely with data coming from multiple branches. Therefore it is available as a prebuilt report with a single branch limitation.
Historic Inventory
The historic inventory report features a by year by month breakdown like the historic sales table, however this chart focuses on the value of the inventory for the selected branches over time. Each month, the Counterpoint Cloud Platform takes a snapshot of your inventory on the 1st and saves it for the purpose of this graph. This allows us to offer a historical representation of your inventory to draw comparisons and trends from.
Additionally, a month by month graph is available to better visualize trends in inventory value over time.
In some scenarios, it may be possible to import additional historical data from outside the Counterpoint Cloud Platform on a one-time basis. For inquiries, contact AMS.
Detailed Sales History
The detailed sales history report gives you a month over month comparison of both sales figures and GP values on a per category basis, for one of more branches.
Detailed Inventory History
The detailed inventory history report gives you a month over month comparison of inventory values and changes on a per category basis, for one or more branches.
Day of Week Sales
Invoice count analysis broken down by day of week, and represented in a bar graph. You can modify the time range used in order to evaluate your busiest days and hours
There are also a number of additional metrics included, by day.
Detailed Sales History
A breakdown of sales based on clerk and based on the group of clerks that represents in-store vs online sales, with some extrapolated data on clerk performance mixed in.
Detailed Sales History
A searchable, per-line breakdown of sales history for the entirety of the dataset available.
Sample Report
Below are the steps for creating a basic report of sales by customer/category
In Section 1, you will want to select Sales:

In Section 2, this is where you would select the pieces which you want detail on, and what the sales will be totaled by. In this case, Account Number, Company Name and Category. This means we will get a report by Account Number, Company Name and possibly Category

In Section 3, you pick what totals you want by Account Number, Company Name and Category. In this case, I am going to select SUM(Total Line Value) to get sales dollars and SUM(Total Line Cost) to get cost of sales. This means I will get a report on total sales and cost of sales by Account Number, Company Name, and Category.

Section 4 I'm going to pick a date range. In this case, I'm just selecting last month. Clicking on the calendar in the input field will bring up the calendar date picker.

Finally, in section 5, you can filter the data that will show. As of right now, I have a full report on Sales and Cost of Sales by Customer, Company Name, and Category. If I want to just return info on Brinks, this is where I would make that call-out by selecting to filter on Account Number.

Then, I just need to click the Generate report button and I will get a table below with the information I asked for.
If there are multiple pages, there will be page navigation at the bottom, and if you want to pull it out to excel you just need to press one of the export buttons at the top right of the table.
This is just a quick sample, dates can easily be adjusted and extra detail like category could be left off to get a more summarized total of the customer's sale, but it is a good idea of what you can get from the report generator.
Web Reports
Overview
Web reports allow for the management and distribution of custom reports where the necessary information may not be maintained within the Cloud Platform.
Web reports also allow for the tracking of 'signatures' on reports. Asking the reader to sign a report as read and keeping track of which reports have been read by whom.
Setup and Maintenance
The setup of the report portion of a web report is primarily done by AMS. A user would call AMS and request that a specific report be added to the Counterpoint Cloud web report feed and we would ensure that the report was set up and available for maintenance in the Cloud Platform
Once a report is set up, a user would define which other users are to receive the new report. This maintenance is done in CP2 Admin > WebReport Management
Reviewing Reports
When a report is sent, all users set up to receive the report will receive an email from the system indicating that a new report is available. A link within that report will take the user to the report for review.
The report, as viewed in the WebReport viewer is presented in a table format that can be downloaded with a single click of the large blue Download button in the top right of the screen.
When viewing the report, the user will be presented with the option to sign the report at the bottom. Once a user signs a report, that signature is tallied and shown when browsing the WebReport listing page.
CP2 Admin
Admin CP
Overview
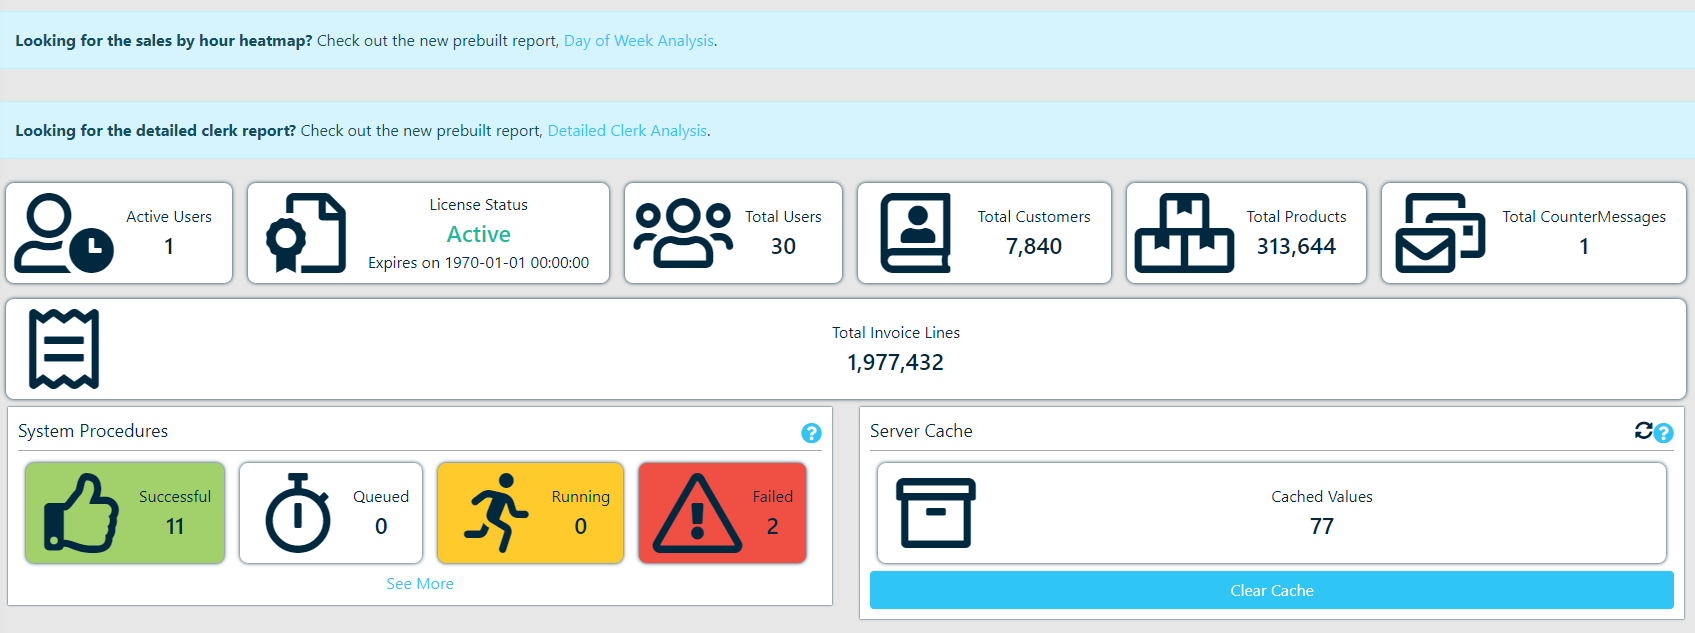
The Admin CP page provides you with a quick, at-a-glance view of some of the important statistics and metrics of the Cloud Platform as a whole, and how your data has been loaded, etc.
Info Tiles
Active Users
The total number of users currently logged in to your instance of the Counterpoint Cloud Platform
License Status
Current status of your Counterpoint Cloud Platform license
Total Users
Total number of users set up in your instance of the Counterpoint Cloud Platform
Total Customers
Total unique customers loaded in your instance of the Counterpoint Cloud Platform
Total Products
Total unique products loaded in your instance of the Counterpoint Cloud Platform
Total CounterMessages
Total number of outstanding CounterMessages
Total Invoice Lines
Total number of invoice lines loaded in your instance of the Counterpoint Cloud Platform
System Procedures
This panel shows a status of the automated system procedures that are run. By clicking the See More link, you can view the detail of these procedures and trigger a restart of any failed procedures
Server Cache
The Counterpoint Cloud Platform uses caching in order to improve performance. This panel shows how many different datasets and queries have been cached. If, for some reason, old data is being loaded and displayed you can optionally clear this cache in order to force the server to pull fresh data queries.
Address Book
User/Email combos input into the address book will appear for all users to select from when sending a message via Counter Message.
Typically, it is a good idea to enter your own support/counter emails into the address book, as an easy way for your salesreps to be able to contact whoever is monitoring them.
If there are no email addresses entered here, the address book will appear empty when a salesrep tries to use it to add an address.
Admin Alert
An admin alert is a message that is displayed to all salesreps on their landing page after they log in. This allows one way communication between you and all of the salesreps you have on staff that they'll be greeted with when they log in.
As you edit the alert message ,the alert on the screen should update in real time, displaying exactly how the message will display when your salesreps see it. There are 4 different styles of alerts available, for varying levels of severity.
Additionally, once you are ready to save your message, there are 2 different buttons which will do so:
- Update Quietly - this saves the update, and requires salesreps to go back to their home page to check for a new message.
- Update With Alert - this saves the update, and generates a system alert for each salesrep notifying them that a new admin alert has been posted, lasting for 12 hours.
Server Settings
The values in the server settings page are used across your version of the Counterpoint Cloud Platform to change the way some pieces react, as well as enable/disable some elements of it.
Warning: Your copy of Counterpoint Cloud Platform heavily relies on some of the settings on this page. Before you change a value, take the time to read through the documentation and make sure you completely understand the value you are changing. It is possible to do permanent damage to your data from here, or render your Cloud Platform inoperable. If you do render your Cloud Platform inoperable, there may be additional billing charges associated with restoring your access.
Also note that it is possible to input an invalid value here, and break sections of your Counterpoint Cloud Platform installation.
If you have any doubts, contact AMS before making any changes.
- Warning on Admin Settings Page
Generally speaking, it is a good idea to leave this page alone and let AMS handle the changing of any settings.
Audit Log
The Audit Log contains a list of auditable events that have occurred in your instance of the COUNTERPOINT Cloud Platform over the past 90 days.
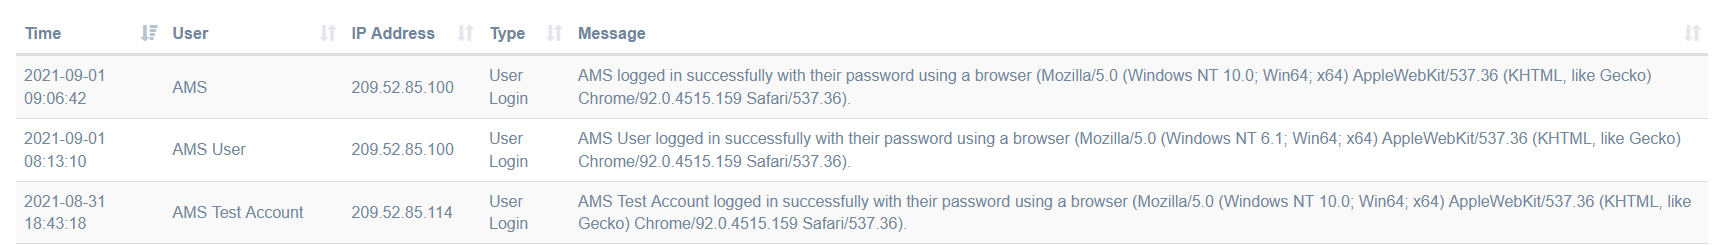
Event Types
The following is a list of event types that are logged in the Audit Log:
- A user successfully logging in via a browser
- A user successfully logging in via the CP2 Desktop Application
- A user automatically being logged in via the CP2 Desktop Application
- A Manager logging into another user's account via Manager CP
- A user creating a generic CounterMessage
- A user creating a CounterMessage tied to a customer
- A user signing a WebReport
- A user changing their email address
- A user changing their password
- A user changing their name
- A Procedure being run manually
Procedures
What is a Procedure?
A procedure is an operation that can be done on a regular basis - typically nightly, and it usually involves modifying or updating your data so that you get a better quality analysis on the COUNTERPOINT Cloud Platform.
These procedures are run on "workers", which wake up and process data when there is a procedure waiting to be run. This allows for multiple procedures to run at the same time if necessary, and reduces the impact that running a procedure during store hours can have for other users.
Procedure Statuses
There are 4 statuses that a procedure can be in at any given time:
Successful: The procedure ran and finished as expected, encountering no errors.
Failed: The procedure did not finish as expected, and encountered an error during processing.
Queued: The procedure has not yet run, but is scheduled to as soon as resources are available.
Processing: The procedure is currently running.
Running a Procedure
Note: There are two different types of procedures: legacy procedures, and modern procedures. Only modern procedures can be run manually by an admin. If you need assistance with legacy procedures, please contact AMS.
An admin user has the ability to see the current status of all procedures, as well as manually trigger a process to run. This should be done carefully, as it may have side-effects that change the data other users of yours see.
Most procedures are scheduled to automatically run - if you think one or more procedures need to be run at a different time or frequency, contact AMS for assistance in changing their schedule.
The ability to manually run a procedure is mostly used as a recovery option in case something goes wrong with the overnight data upload. Alternatively, some procedures are used to clean up or remove old data and are not run regularly. Consult the table below for an explanation of what each procedure does. If you are still not sure whether running a procedure is a good idea, contact AMS for assistance.
Procedure List
| Procedure Name |
Procedure Description |
Default Frequency |
| ACADataMapping |
Maps products to their ACA data classes and subclasses. If this is not done regularly new products will not be mapped and will show up under the "Null" ACA class. |
Daily (If Enabled) |
| annualSalesCalc |
Calculates the number of annual sales for the previous 12 months, as well as the 13-24 month range. This is used to generate old stock reports. |
Daily |
| CPMailerReports - Daily |
Sends out all of the CPMailer daily reports. |
Daily |
| CPMailerReports - Monthly |
Sends out all of the CPMailer monthly reports. |
Weekly |
| CPMailerReports - Weekly |
Sends out all of the CPMailer weekly reports. |
Monthly |
| discountCodeTable |
Builds a table of all possible discount code values. Required for any analysis that offers a breakdown by discount code. |
Daily |
| FillCustomerNames |
Fills in the customer name on any ship to values that do not have an assigned name with that of the root customer. |
None |
| FillDeletedCustomerIndustryType |
Fills in the industry type on any ship tos that do not have an assigned value with that of the root customer. This is typically caused by a ship to being deleted. |
Daily |
| IndustryTable |
Builds a table of all possible industry codes. Required for any analysis that offers a breakdown by industry type. |
Daily |
| monthlyProc |
Calculates the inventory position based on last night's upload and saves it as the historical value for the month that "yesterday" fell in. You probably do not want to run this manually. |
Monthly (1st) |
| productsFromHistory |
Adds non-stocking products from your sales history into the products database. This is required for any analysis that groups sales by product to function correctly. |
Daily |
| territoryTable |
Builds a table of all possible territory codes. Required for any analysis that offers a breakdown by territory type. |
Daily |
| updateGoals |
Updates goal calculations for all goals that have been added. |
Daily |
Corporate Goals
Overview
The corporate goals page shows a listing of ALL goals set up for your company, but also allows you to set a company wide goal for all users to see.
Listing
This listing will show all goals set up for your company, whether they are company wide or sales rep specific. You can view the details of any goal, or assign any goal as a primary goal here.
Setting up a new corporate Goal
At the bottom of the listing is a New Goal button. Clicking this will present you with the goal setup page.
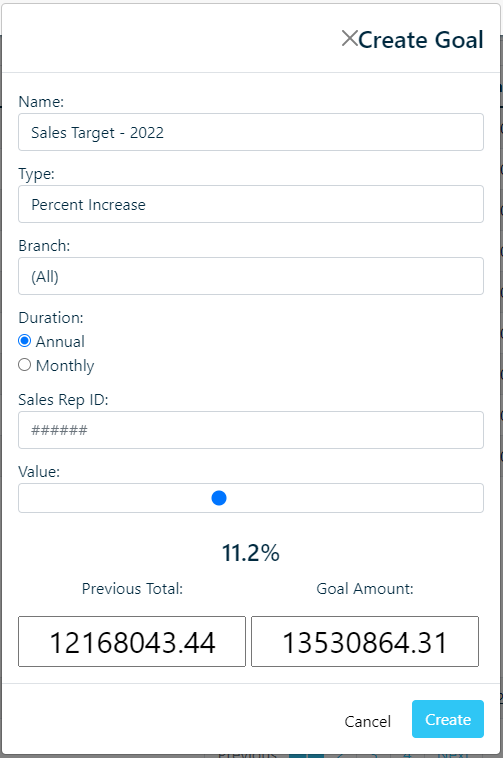
When setting up a corporate goal, the following should be filled in:
- Name - The name that will show associated to this goal
- Type - Percent increase, which will set a percentage increase of sales over last year
- Branch - Optionally pick a single branch for this goal to be assigned
- Duration - Either a single month's goal, or an annual goal which will create 12 monthly goals
- Sales Rep - For a corporate goal, the sales rep is not set.
- Value - The percentage of increase you would like the sales to increase by
Once a corporate goal is set, all of your users will be able to view it and/or apply it to their account as a primary goal with prominent placement on the homepage.
Goals are calculated on a nightly basis, so immediately after setting up a goal, it will not be visible.
Registration and Users
Adding and Maintaining Users
Registering a new user
Sending invite email
Registering a new user is done via an invite based method which can be initiated by any Counterpoint Cloud Platform admin user within your company.
Sending the invite can be done by going to the CP2 Manager tab in the left-bar navigation pane
Fromt he CP2Manager menu, click the Add User button at the top

This will present you with a basic user information form:
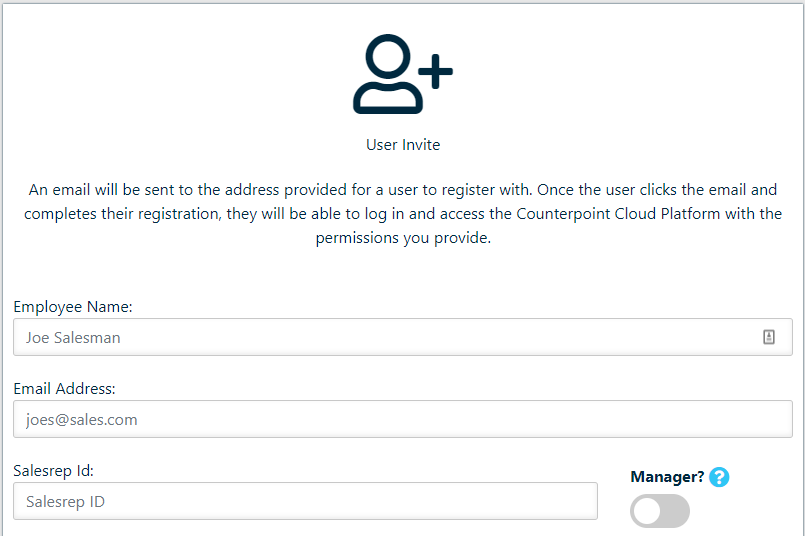
Information on this form is gathered in order to set up just the most basic user information and send out an invite for the user to configure their username and password
Employee Name: The Employee's name as it will appear on reports, etc.
Email Address: The email address which to send the registration invite to.
Salesrep Id: The sales rep ID that this person uses. This should match the sales rep id that is assigned to a customer.
When this is filled in, the user will only see customer listings and sales figures for their assigned customers
Manager: Marking a user as a manager allows them to see sales data for customers of other sales reps
Branch: You will also be given a listing of valid branches. You should assign the user's primary branch here.
Receiving the invite email
The user should then receive an invite email from the notifications@counterpoint.cloud email. This email will contain a link within it that, when clicked on, will direct the user to their own registration page.
If the user does not see a registration email in their inbox, have them check their SPAM filter
Completing the user registration
When the user clicks on their email, they will be directed to a sign-up form
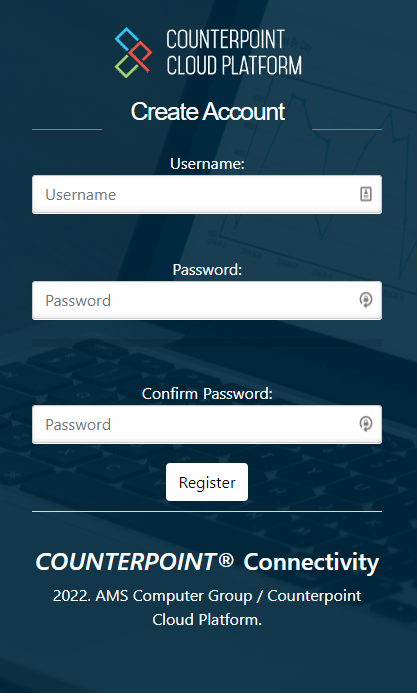
The user will enter in their desired username and a valid password.
Counterpoint Cloud Platform does require complex passwords and will notify you if the chosen password does not meet the minimum requirements of the service.
Upon successful completion of the user setup, your user will be presented a link to log in.
Managing users
Once a user is set up in the platform, you can manage the user by going to the CP2 Manager tab in the left-bar navigation pane. Once in the CP2 Manager pane, you can select to edit the user you wish to manage. The user management screen has 4 possible panes to manage different of the user
User Profile
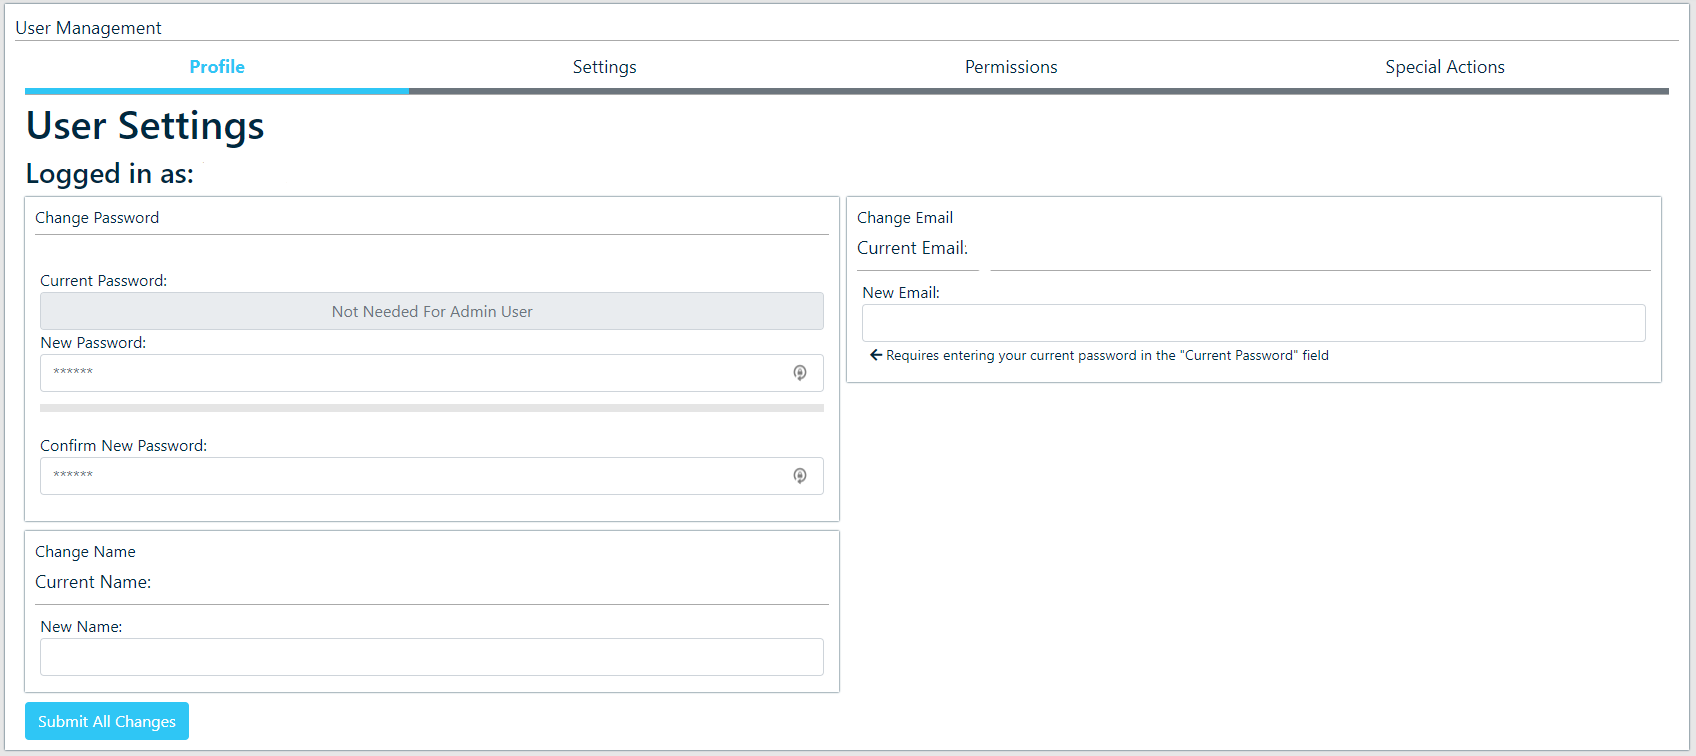
The Profile tab allows you to change the following
- Password: A user's password can be modified here.
As an admin user, you are not required to enter in a user's current password in order to make this change
- Name: Change a user's name as it appears on reports, etc.
- Email: Change the email associated with a user's account
User Settings
The user settings tab manages server settings and default values used by the system. These changes should not be made without first reviewing the possible options with AMS to avoid causing problems with the user's account.
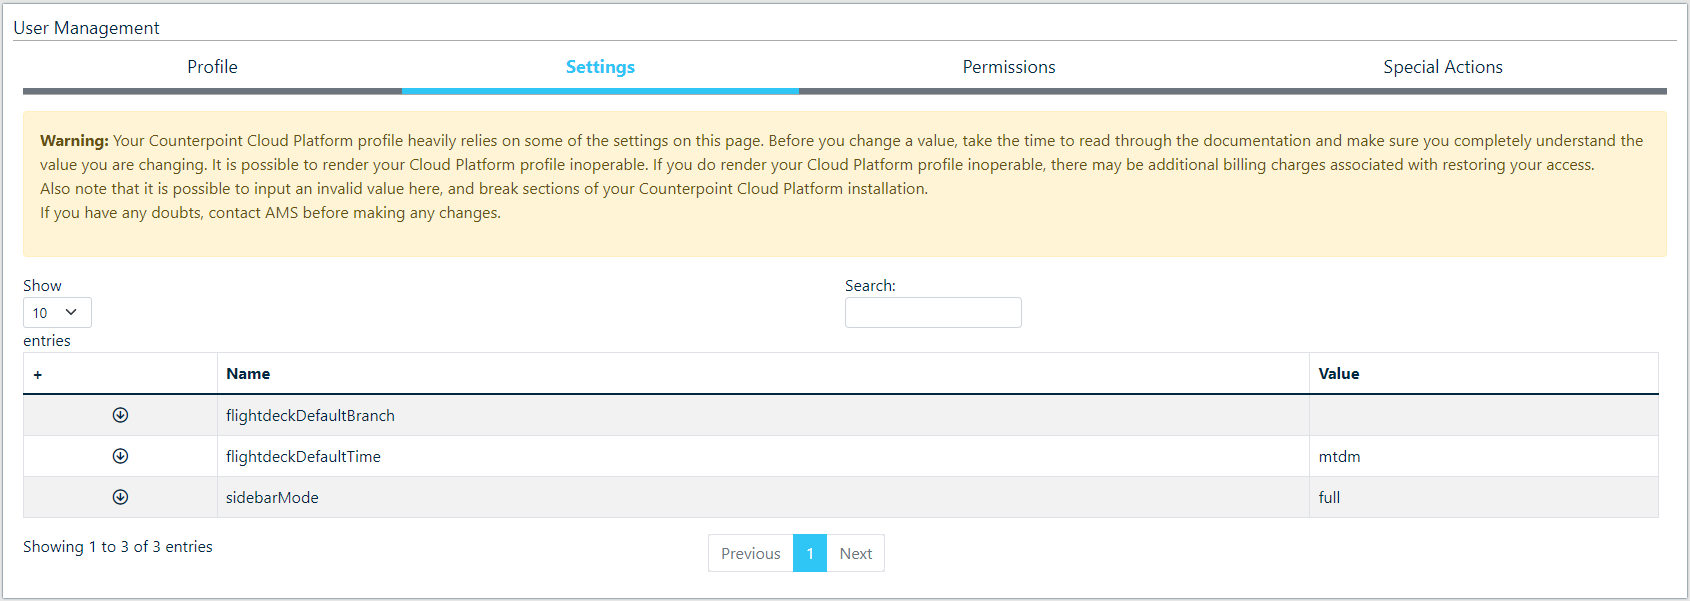
The user settings tab allows you to manage 3 server values
- flightdeckDefaultBranch: The default branches displayed when you load the FlightDeck Dashboard. This should be a list of branch IDs separated by commas. ( "01,02,04,12" ) or left empty to display all branches.
- flightdeckDefaultTime: The default time displayed when you load the FlightDeck Dashboard. Possible values: "mtdm", "ytd", "mtdy", "p30", "p60", "p90"
- sidebarMode: The mode to draw the sidebar in. Either full or small.
User Permissions
A user's access to store branches and the various modules available within the Counterpoint Cloud Platform are all managed within this tab
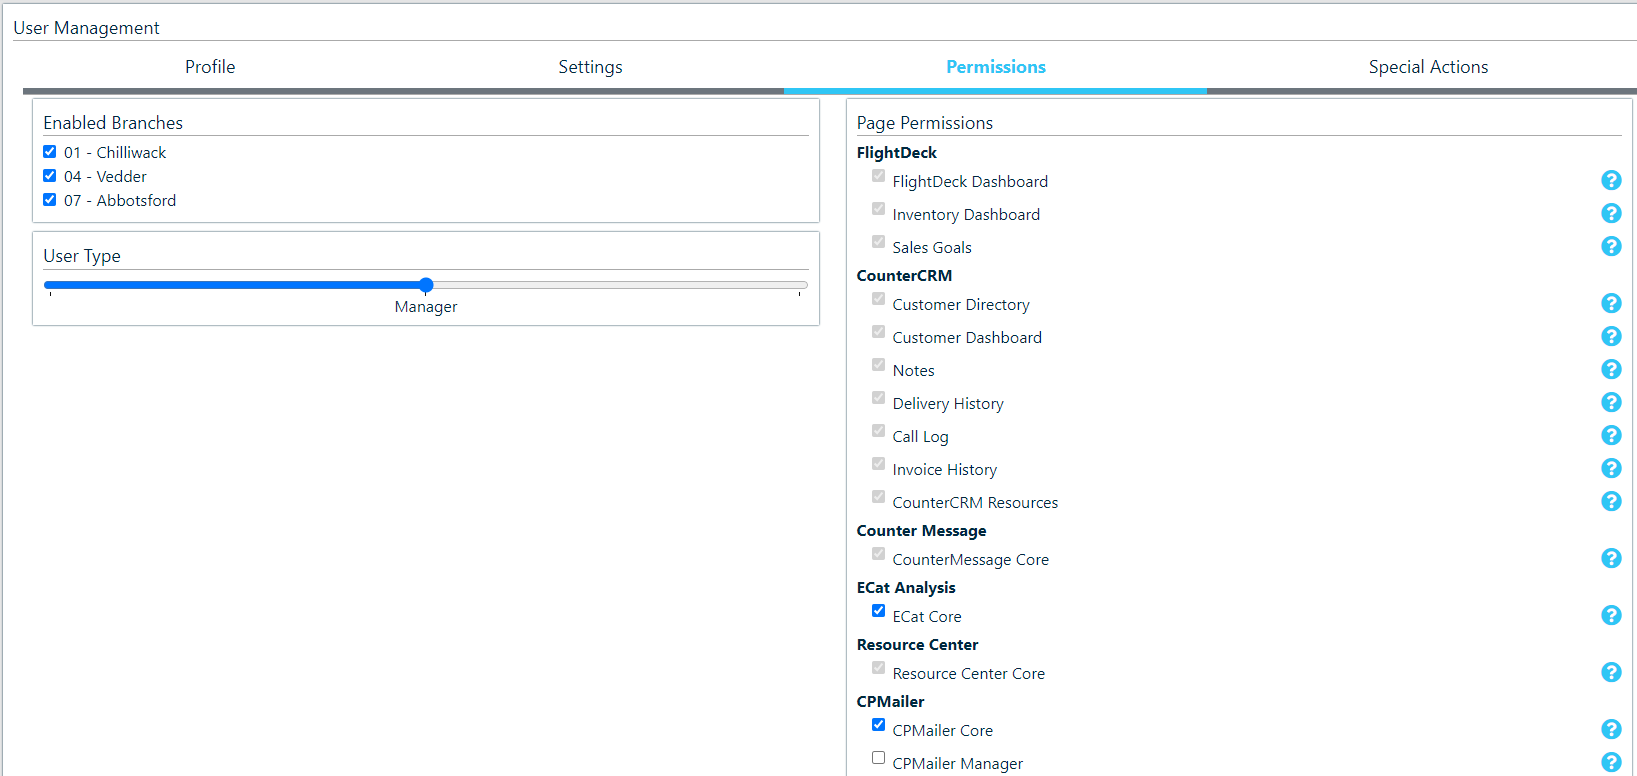
- Enable Branches: Here you can activate a user's access to your branch locations
- User type: This allows you to elevate or lower a user's global access level
- Page Permissions: This allows you to grant access or revoke access to specific pages within the Counterpoint Cloud Platform
Based on a user's global access level, some pages are deemed 'required' and will not be able to be revoked.
Special Actions
This tab allows for special actions to be taken on an account by an admin user
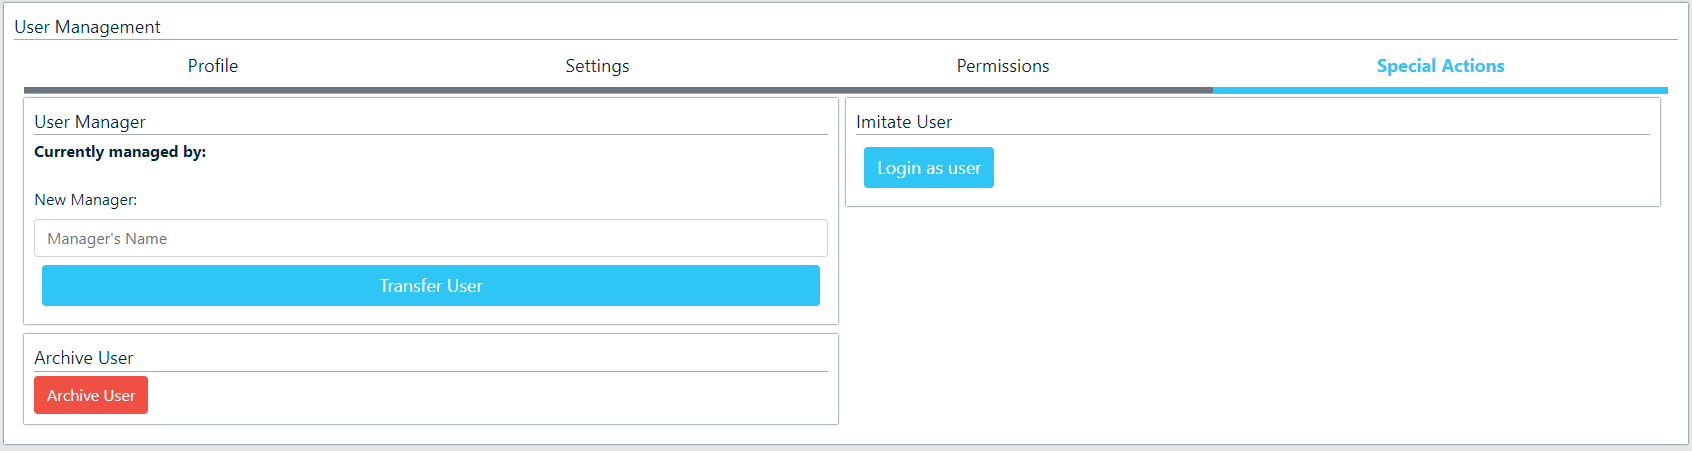
- User Manager: This assigns another user as the manager of the user selected. This will allow you to assign a 'Manager' level user control of a 'User' level user
- Archive User: This will essentially disable a user. It does not delete the user, as this may break certain functionality, but it renders a user inoperable and unable to log in.
- Imitate User: Allows you to log in as the user and see their view of the Cloud Platform
User Types
There are three different types of users, each with their own restrictions on what permissions apply to them:
User
A normal user can be limited in the modules they see, branches they can access, and are limited to their own sales in most cases.
Manager
A manager user can be limited to the modules they see and the branches they can access, however they are able to see sales data regardless of the associated sales rep.
Assigning a salesperson ID to a manager will have no effect on their ability to see information.
Admin
An admin user can not have permissions applied to them based on modules, branches, or salesreps. An admin user is granted all permissions available.
Permission Errors
You currently do not have permission to view any branches.
This message is displayed on every page when logged in as a user that does not have access to any branches. With the new permission system in Beta 1.3, every user must be granted explicit permissions as to what information they are able to use.
If you are the user seeing this message, contact your manager or whoever sent you the invite link to the Counterpoint Cloud platform and ask them to give you access to one or more branches.
If you are the manager of a user who is seeing this, navigate to the ManagerCP module and edit the user's permissions to grant them access to one or more branches in your Counterpoint Cloud instance.
Module Details
FlightDeck
FlightDeck Dashboard
Enabling the FlightDeck Dashboard gives a user access to sales either tied to their salesrep id, or all sales in the case of a manager for branches which they have permission to. Users can filter the data by time periods, branches, and specific customers.
Inventory Dashboard
Enabling the Inventory Dashboard gives a user access to all of the inventory data for all branches which they have permissions to access. This includes total inventory value, various value breakdowns, old/low stock tables, and value comparisons against company totals.
Sales Goals
Enabling the Sales Goals module allows a user to track the progress of a branch, or of their own sales performances over a period of a given month or year.
CounterCRM
Customer Directory
The Customer Directory module allows a user to lookup a customer based on their other information. With access to the Customer Dashboard module, clicking on a customer will load into their CounterCRM Dashboard.
Customer Dashboard
The Customer Dashbord breaks down sales for a given customer similar to the FlightDeck Dashboard module. In addition the Customer Dashboard module serves as a central point for seeing information from the other CounterCRM modules, CounterMessage messages, and imported data on jDispatch deliveries.
Note: Requires access to the Customer Lookup module to function properly.
Notes
The Notes module of CounterCRM imports notes assigned to a customer in COUNTERPOINT and displays them. The Notes module also allows for the creation of additional notes for a specific customer, with the ability to return a note back to COUNTERPOINT available in a future version.
Note: Requires the Customer Directory and Customer Dashboard modules to function properly.
Delivery History
The Delivery History module imports a history of deliveries made to the customer, via jDispatch.
Note: Requires the Customer Directory and Customer Dashboard modules to function properly.
Call Log
The Call Log module provides a history of calls involving the customer, imported from your AMS Unified Communications platform.
Note: Requires the Customer Directory and Customer Dashboard modules to function properly.
Invoice History
The Invoice History module provides a history of invoices tied to a customer. Also includes the ability to recall an invoice PDF file thats to integration with your COUNTERPOINT web server.
Note: Requires the Customer Directory and Customer Dashboard modules to function properly.
Counter Message
Counter Message Core
The CounterMessage module provides a quick, auditable method to send a message to an email address entered in the address book of your Counterpoint Cloud platform. Message is sent via email and offers a method for the recipient to reply to the message, automatically archiving the message and generating an alert for the user who sent it.
ECAT Analysis
ECat Core
The ECat Analysis module provides a breakdown of online sales, part lookups, and lost sales that occur through the autoecat.com website.
Note: This module does NOT respect branch permissions at this time. Granting access to this module grants permission for all branches.
Resource Center
Resource Center Core
The Resource Center module provides a quick way to upload files into the Counterpoint Cloud Platform either for your own use in the future, or to be made public for other users to see.
CPMailer
CPMailer Core
The CPMailer Core module allows a user to view and edit their own daily/weekly/monthly CPMailer messages based on any of the blocks available on the system.
CPMailer Manager
The CPMailer Manager module allows a user to modify the CPMailer messages of users that they are the assigned manager of. This also allows the creation and management of CPMailer Users.
Note: Requires the CPMailer Core module to function properly.
CPMailer Special
The CPMailer Special module allows a user access to enable/disable the special reports (such as monthly/weekly customer alerts) on a company-wide basis.
Report Generator
Customer Reports
The Custom Reports module allows users to create their own reports based on all of the information available in the Counterpoint Cloud Platform. this also includes the ability to save and rerun previous reports.
Note: Saved reports are available to all users who have access to this module, however the branch restrictions of users will still apply.
Note: This module does not respect a users salesrep permissions. By granting access to this module, you are granting a user access to the sales data of all salesreps.
Prebuilt Reports
The Customer Reports module grants access to prebuilt reports added to the Counterpoint Cloud Platform to be run against your data. These reports offer unique breakdowns and perspectives into performance in ways that do not fit into other modules or formats.
CP2 Admin
Admin CP
The Admin CP module grants access to some information specific to your Counterpoint Cloud Platform, such as billing cycle and registered users.
Address Book
The Address Book module grants access to editing the address book used within the CounterMessage module.
Corporate Goals
The Corporate Goals module grants permission to create corporate goals, which are then visible to all users.
Admin Alert
The Admin Alert module grants access to the ability to modify and enable/disable the message that is displayed to all users on the first page after login.
Server Settings
The Server Settings module grants access to all of the settings that can be changed for your Counterpoint Cloud Platform.
Note: The settings in this module can have disastrous effects on the performance of the Counterpoint Cloud Platform, and restoring issues caused by carelessness in this module may have additional billing costs.
Branch Management
The Branch Management module grants permission to edit the categories and groupings of branches that all users are able to use to quickly select groups of branches throughout the Counterpoint Cloud Platform.
CP2 Manager
Manager Core
The Manager Core module grants a user access to invite new users to the Counterpoint Cloud Platform, and allows them to edit users that have been assigned to them.
QuickDial
QuickDial is the module of the Counterpoint Cloud platform designed for call centers, and provides full integration to the user Point-Of-Sale
QuickDial Requirements
Before being able to access QuickDial, there are a few requirements that need to be met
- Download the Counterpoint Cloud Platform App from https://counterpoint.cloud/app.php

- Download the current Zulu softphone app from https://zulu-updater.sangoma.com/releases/stable
- Get Counterpoint Cloud Platform Credentials
- These can be created by a Counterpoint Cloud Platform admin, or your AMS Support Team
- Get Zulu Credentials
- These can be provided by your AMS Support Team
- Open the Counterpoint Cloud Platform Desktop App and log in with your credentials
Once logged into the Counterpoint Cloud Platform, you will stay logged in indefinitely

- Log into the Zulu Desktop App - AMS will provide all required information
When logging into the Zulu App, your username should be the same as your extension

- Once you have successfully signed into both of these applications, you can begin to take calls with the QuickDial application
Answering Calls
Zulu Caller ID
Once you have signed into both the Counterpoint Cloud Platform and Zulu Apps, you can begin taking calls that will automatically launch the QuickDial application.
The first thing you may notice once you have signed into Zulu is that the caller ID of the incoming call will pop up in the top right corner of your screen
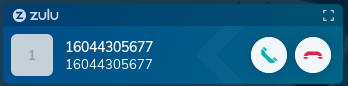
Seeing this indicates that you are successfully registered with the Zulu App. If you do not see this when your phone rings, then there may be an issue with the Zulu registration, or the credentials are pointing to the incorrect extension. Your Zulu username should match your phone extension
QuickDial Pop-Up
Now, when you pick up your phone, the QuickDial application will pop up using the caller ID phone number to try and access the customer's information. This pop-up is where you pick which customer you want to launch and can show 1 of 3 different scenarios
Unknown Customer
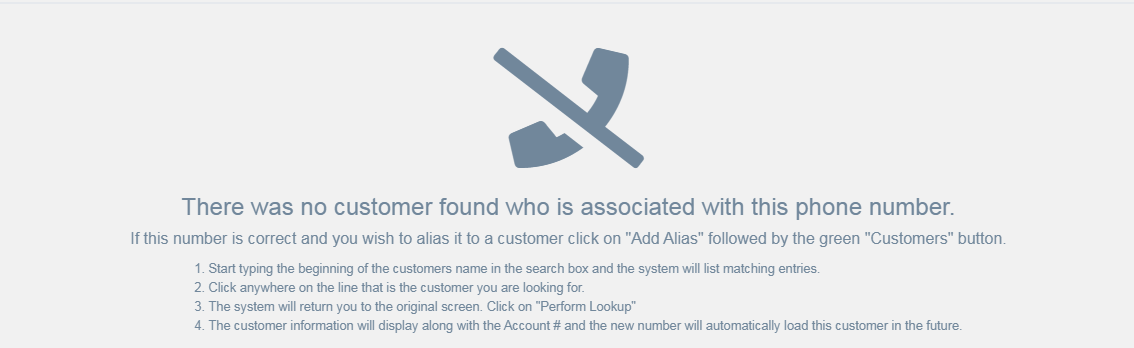
In the case of an unknown number, you will be presented with a message indicating that the system could not find the number in the system, but will give you the option to add an alias for that account.
Aliases are relationships between phone numbers and accounts that are contained within the Counterpoint Cloud Platform and there is no limit to the number of Caller IDs assigned to a customer.
You can find a full document on adding an alias HERE
Known Number Assigned to Many Accounts
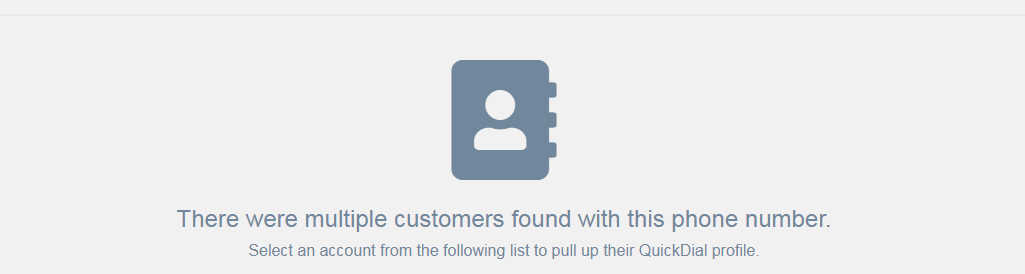
In some scenarios, the call may be from a number that is assigned to many accounts. In this scenario, you will be presented with a screen showing all of the available accounts. In this screen, the accounts are classified based on their status as well as their A/R standing.
Primary Account

This is the main account for this customer
Secondary Account

This is an active account for this customer, but not the primary account. In scenarios where you see this icon, you will also be able to find a primary account as well.
Inactive Account

This is a valid account number, but the account is no longer active. You cannot click on this account
Hold Account
This account is valid, but the customer is currently on hold
Known Number For Single Customer
If the callerID that is passed is that of a single customer whom the system knows about, you will be passed into the caller's main QuickDial Screen right away
Picking up a Parked / Active call
In cases where you are pulling a call off of park, the QuickDial screen will not already be active for that customer. However, you can recall a QuickDial screen for a currently active call is possible with only a few clicks.
Once you are back to the main QuickDial page, you will see a listing of any currently open calls (This is defined as a call that has been picked up, but not yet hung up.)

Simply click on the call you have answered (you can use your phone's callerID to validate the caller) and you will be brought to the QuickDial summary page for that customer.
Adding an Alias
Customers may call from numbers that have not yet been entered into your main ERP, or added into the cloud platform. In these cases, you will be given an opportunity to add them when the QuickDial page launches.
When an unknown number calls in, you will get a screen indicating such

Click on the 'Customers' button to bring up a customer search screen. Use the "Search" field to find the customer you wish to associate with this number. When you have found the customer, click on the customer number.

Once you click on the customer number, you will be returned to the original 'unknown number' page, but the account number field will be populated with the account number of the customer you just searched for. You can now click 'Perform Lookup' to look the customer up this one time, OR, check the 'Add Alias' box and click 'Perform Lookup' to create a relationship between the phone number and account so that the system will recognize the caller next time

Once you click on the Perform Lookup button, you will be redirected to that customer's QuickDial page.
QuickDial Summary Page
Overview
Whether the page opens automatically on call pickup, or you need to select the account due to multiple accounts being available, the first QuickDial page you will see is the QuickDial summary page. This page contains high-level information on the account as well as action buttons to create orders
Customer Quick Statistics

The customer quick statistics just cover some of the basic information on the account, the customer number, sales rep, main number, and main contact are all the current values from your system
The Time at servicing branch is the current local time at the servicing branch for this customer
The Next Run is the next scheduled delivery run (in local time) for this customer, if they are set up with a delivery run.
Action Buttons
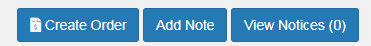
Create Order: Clicking this button will launch an order entry screen to create an order for this customer. If there are multiple ship-to addresses, you will see a different 'Create Order' button and be given the option to select the ship-to for which to create an order:
When launching an order screen, the order will be created in the servicing branch selected. This will save you needing to select a branch once you begin creating the order
Add Note: This button will allow you to create a specific note on the account that will show when using the CounterCRM module of the Counterpoint Cloud Platform. Additionally, if the note type is set to the default 'pop-up' note type, the note will show as a pop-up any time the QuickDial screen opens for this account.
View Notices: This will display any outstanding CounterMessage tickets on the account.
Current Deliveries
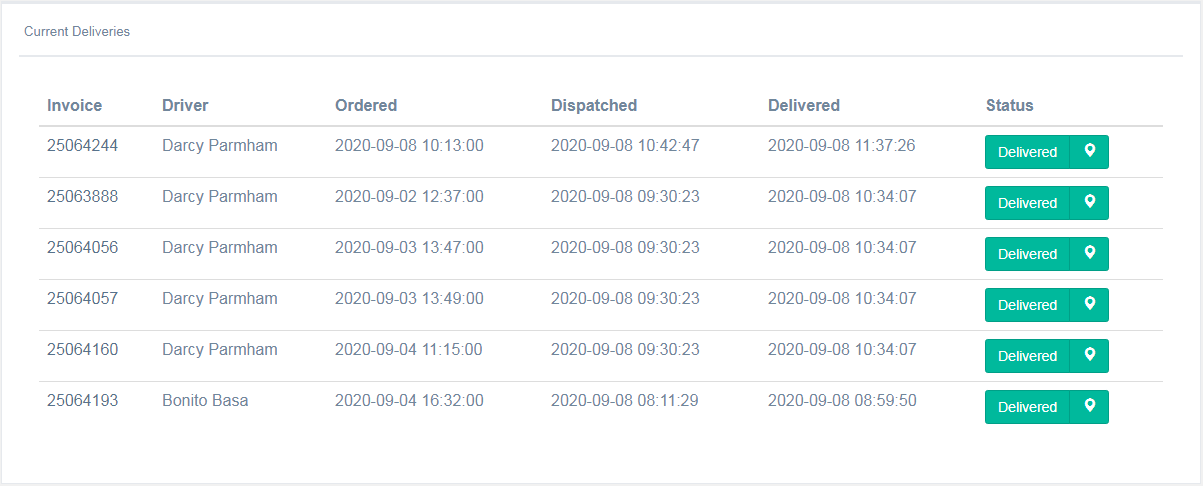
Current Deliveries section relies on JDispatch. If you are not currently using JDispatch, this section will be blank
This section is a current status of invoices for this account for today. This will include invoices received, in transit and delivered as well as the timestamp for each of the stages. For any delivered invoices, the signature will be available by clicking on the status button. If you are using JDispatch Premium, you will also be able to see the location of the driver for in transit orders, and the location of signature capture for any delivered invoices.
Customer Call History
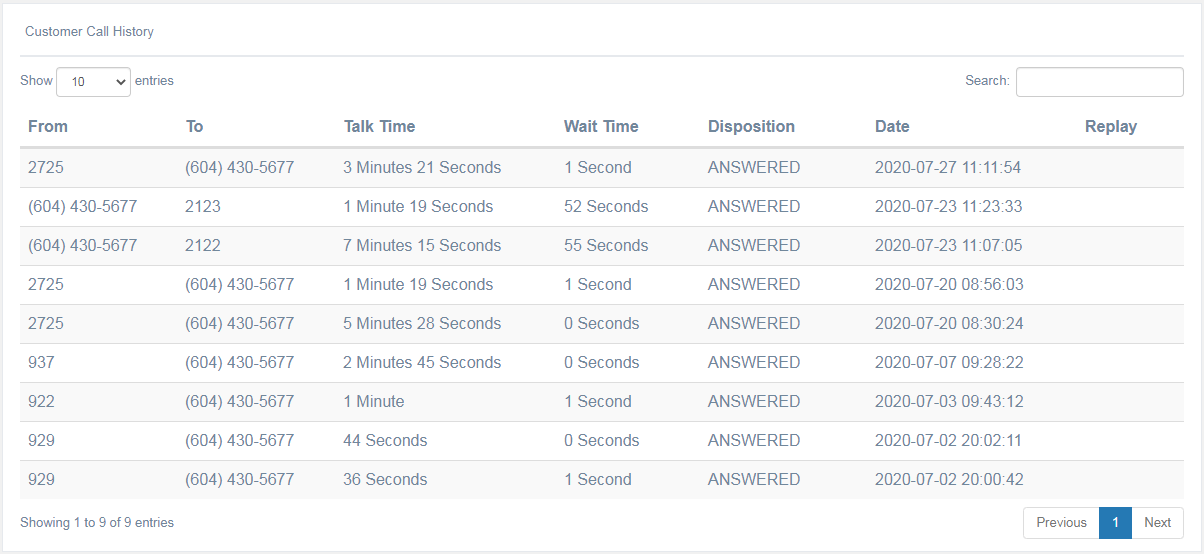
Customer call history is a listing of all calls to and from this customer. This can include any of the numbers associated with this account. This will show who called, whether it was inbound or outbound, how long the call lasted and, optionally, offer a recording download if you have configured your AMS PBX to record phone calls.
Invoice History
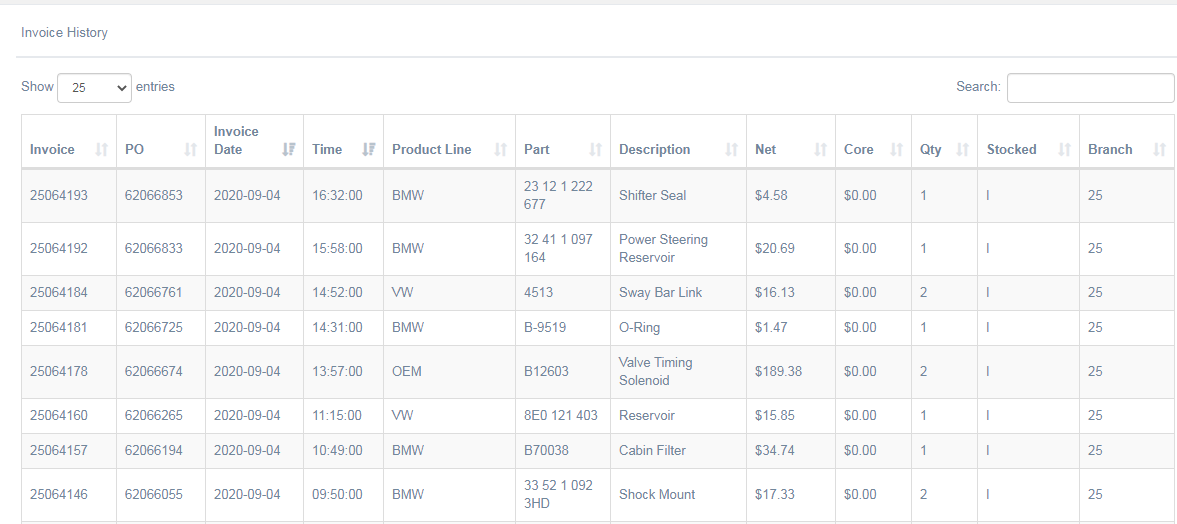
The invoice history section shows detailed history of invoices prior to today. This entire listing can be searched by any of the information in any columns. To search, simply start typing into the 'Search:' field and the results will begin filtering automatically.
A future release of QuickDial will contain the ability to email a .pdf copy of the invoice to an email assigned to the account.
E-Catalogue Statistics
These statistics are loaded on a nightly basis, so they do not include today's data
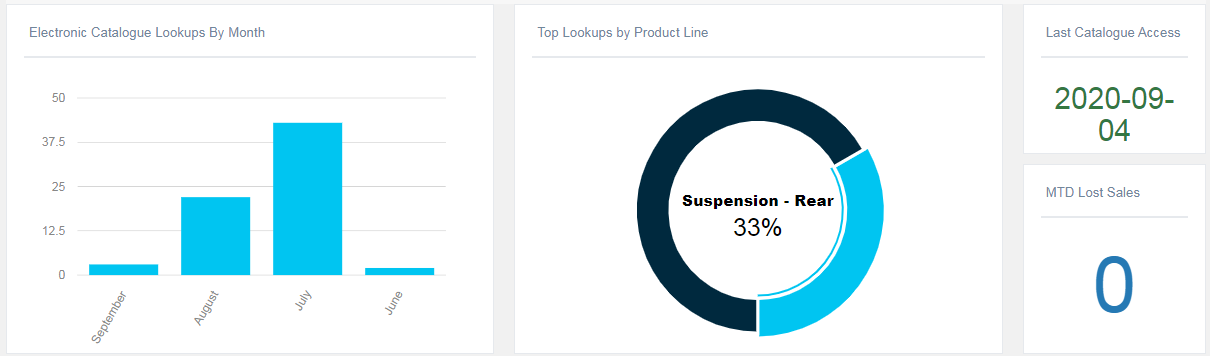
The last of the summary info on the QuickDial summary page is a snapshot of some basic e-cat statistics. These are:
Lookups by month: Total lookups by month, for up to the past 6 months.
Lookups by product line: Lookups by catalogue product group for the current month-to-date
Last Catalogue Access: The last date (not including today) this customer logged into the catalogue
Common Error Messages
You currently do not have permission to view any branches
The account you are signed in as doesn't have permission to view any branch data. As of version Beta 1.3.0 each user must be granted explicit permission to each branch they are able to see the data of.
To be granted access to a branch, contact your manager or the user who sent you the invite to register on the Counterpoint Cloud Platform.
You currently do not have permission to view any sales data
The account you are signed in as doesn't have permission to view any sales data, because it is not a manager's account and has no associates salesrep id. As of version Beta 1.3.0 each user must either have an associated salesrep id or be a manager in order to view sales data.
To either become a manager or have a salesrep id associated with your account, contact your manager or the user who sent you the invite to register on the Counterpoint Cloud Platform.
Please enable JavaScript to use the Counterpoint Cloud Platform
The browser you are using either doesn't support JavaScript, or has it turned off.
In order to use the Counterpoint Cloud Platform, you will need to switch to a browser or device that is capable of running JavaScript.
You appear to be using an unsupported browser. Some features will not load correctly.
The browser you are using is likely Internet Explorer, which is not supported by the COUNTERPOINT Cloud Platform.
Alternatively, the version of the browser you are using is outdated. Please update your browser to the latest version to access the COUNTERPOINT Cloud Platform and all of its features.
Instead, consider using a browser like Mozilla's Firefox, or Google Chrome, and make sure it is up to date. This will ensure that all of the features are working correctly and offering the best browsing experience.
Prebuilt Reports
Information on the prebuilt reports that come with Counterpoint Cloud Platform
Consolidated Sales
The consolidated sales report is a web-based equivalent to the Consolidated Sales report provided in COUNTERPOINT. This report lists current YTD sales compared to previous YTD sales, along with Gross profit and a detailed breakout of the previous 4 month's sales.
In addition, the report allows you to filter on specific branches, as well as export to excel with one click.
Historic Sales
Historic Inventory Report
Detailed Sales History
Detailed Inventory History Report
Clerk Analysis
The clerk Analysis report provides a number of metrics on clerk sales performance.
- Number of active clerks - Clerks with sales in the selected filter timeframe
- Clerk Type Breakdown - Currently can be in-store or online
- Online Clerk Breakdown - Breakdown of clerk sales for online clerks (useful if using more than one ecommerce sales platform)
- Store Clerk Breakdown - Breakdown of clerks sales for in-store clerks
- Top clerks by sales - Top 25 clerks by sales dollars
- Detailed clerk breakdown - A detailed table of clerk sales based on the selected filter timeframe